Montag, 26. Juni 2017

A very lucrative money making maneuvre - stop hunting

Hunting stops is a very lucrative money making maneuvre in more just one sense.

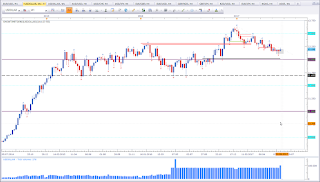
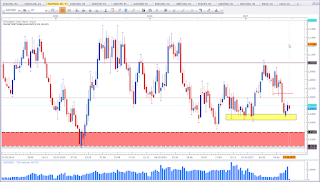
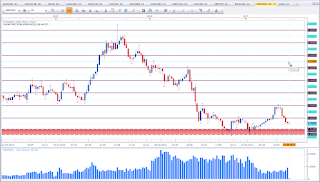
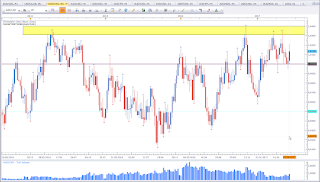
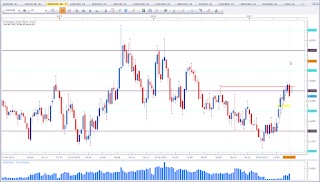
Lets look at the red arrow in the below chart. Before the candle closed, we have a break above a previous high. Breakout traders love to see highs taken out and position themselves. Either a pip or a bigger buffer above the high. Or depending on the timeframe e.g. 5 min chart with a close above. The close serves as a confirmation of a successful break. As you can see, price did move quite some distance above the previous high. And on lower timeframes this looks even more promissing. But then price reverses. There are many differnet type of longs in at this point. Those who missed the longs at lower prices that jump in, Breakout traders, and those that already have been long at lower prices. Some of those traders that took the break of the previous high get scared and close their position. These scared traders add fuel to the bears. There will be also some that expect a pullback to the broken high. But as you can see price moves below the high. And here most of the breakout traders and those that were long form lower levels either close their longs or they get stopped out, as their stops are regularly below the swing high that got broken (support).

Hunting Stops

Now the H4 candle closed as a big Shooting Star / Pinbar. The level is sound. A Shooting star at resistance. There is a fakey (a breakout that failed). There will be many traders that look to short this asset now. The eager ones take the short with the close of the Shooting Star. Others will wait for the break of the Pinbar. And then there are those that trade the smaller timeframes. I personally like such pinbars and would also get tempted to trade this. So am not blaming those that take the short. Fortunately the low never gets pierced so those wating for a break are lucky. The supposed short setup, which is at the same time a fakey (a fake breakout) is a trap for those that short. Most traders who have been long from lower prices get scared and exit their trades, which is not to be blamed. But price continues to move higher. And now short stops get taken out. Eventually the high of the pinbar gets breached, but price retraces again. Those that think now is the time to make some pips jump on board and take the long trades and we have another stop hunt. We have a Bearish Engulfing Pattern. 

This is the reason why we do not want to be the early bird. There are predators waiting for their bait. Let others be the bait.

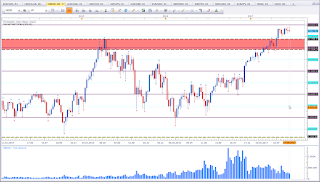
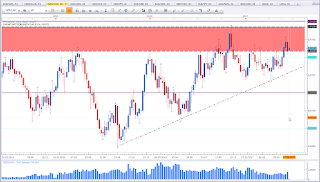
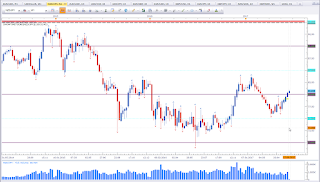
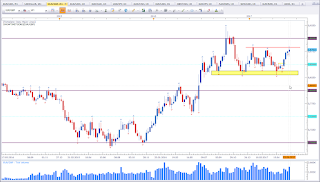
Lets look at the second (green arrow). Below is the same chart again to make reading easier.

Hunting Stops

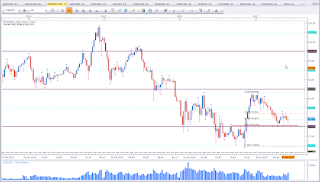
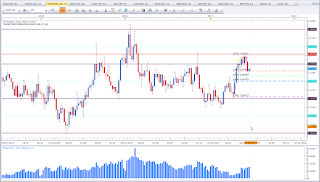
We have a big pinbar. I don't like the location of the Pinbar (Hammer) as it is not at the bottom. But the formation is the same. The interesting point I would like to draw your attention to is, look at how far the low of the pin went. I takes out the previous low (swing low). At the beginning of the H4 Pinbar price was moving up. To some traders this looks like the early stage of a bullish trend (higher high and higher low). To others, this is a pullback of the bigger bearish move from 17,75. At the open of the Pinbar, price is also testing a resistance level. As price moves lower, we have those traders that think this is a bullish market, that get scared. So they close their open longs for small profits or and we have those bullish traders that get stopped out as they have their stops below the former higher. In addition to these bullish traders that are in a loss, there are those traders that see the end of the pullback (of the bearish move) and take their short trades. Either on lower timeframes with the violation of the lows (we have a bullish trend on the m5 timeframe up to the start of the pinbar) or those that have pending shorts at the resistance level as they trade the level. Price moves nicely south and takes out the lows. There are many stop orders below that low. All those stops get triggered and then the market moves up without any of these traders that got engaged already. 
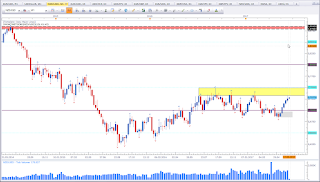
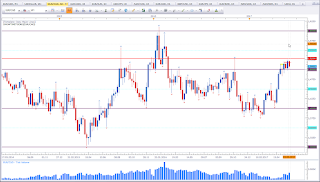
At this point it is very difficult to tell what will happen next. Price is testing again the low with another rejection candle (but big body). We may see price move back up. But I kinda doubt that. What I am certain off is, I am not going to swim with the shark and risk my Butt getting bitten.

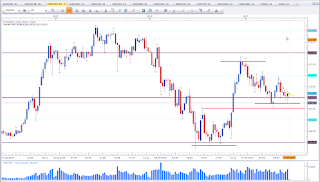
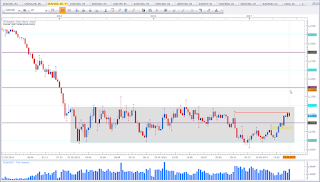
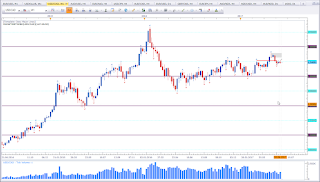
I also marked some candle lows with a red rectangle at the left of the chart. We have Pinbars and Rejection Bars. The stops of the long traders got triggered. This is also a stop hunt. Carl taught us a nice way to avoid this situation. If the long traders had waited for the FFB, they would not have been victims of stop hunters. There is no way to avoid all losses. Everybody will lose. There is no way to avoid getting stop hunted. This is the very reason why we have to be patient and evaluate our trades as price moves. They key word is patience. Be able to adapt to chaning environments. and by all means: DO NOT GET GREEDY

Don't have the profit in your eyes, but always the risk that comes with the trade. Risk is the only thing we have can influence. 

Thank you for reading, If you have any questions please put them in the comments section below.

Happy trading,
TT

Sonntag, 25. Juni 2017

Setups for the week ahead 26.06.-30.06.17

EUR vs CAD

Bearish bias for the week.

Weekly chart of EUR vs CAD

This is the weekly chart of EUR vs CAD. We have an interesting situation. The immediate market structure shows a bullish trend with hither highs and higher lows. And price is currently at a first level of interest with an Indecision Candle. If the trend is strong bullish, we should see a bounce here followed by a move up. The overall market structure however shows a rather sideways move and p rice bounced off resistance around 1,5250. Price made a solid close below the 1,50 level after the bounce off resistance. This puts my bias in favour of the bears. There is enough room until the next support level at about 1,45. Trading this asset requires to keep both aspects in mind. 

AUD vs CAD

Bullish bias for the week.

Weekly chart of AUD vs CAD

This is the weekly chart of AUD vs CAD. There was no follow through on the Morning Star pattern. Price is still at parity, which seems to be a hard to break level. All the long lower wicks show support at this level. As long support holds I'll look to trade support. Hence my bias is bullish for the week.

GBP vs CAD

Bullish bias for the week.

Weekly chart of GBP vs CAD

This is the weekly chart of GBP vs CAD. Price formed a Doji at a level of interest. Basically I am bearish below 1,70 but the Doji at support puts my bias in favour of the bulls. The current level is a potential higher low. I did highlight this level last week and said to keep an eye on this asset. (See here) This week close will be essential. A conservative approach would be to wait for the weekly close. 

NZD vs CHF

Bearish bias for the week.

Weekly chart of NZD vs CHF

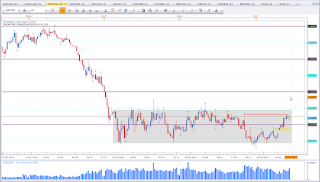
This is the weekly chart of NZD vs CHF. Price did break the range support level in April. Price did test the 0,70 level quickly after the break below. Price is now back again at resistance and formed a Doji. This is a make or break situation. Either resistance will hold or it will break. I'll treat resistance as resistance. That translates to a bearish bias for the week. 

GBP vs USD

Mixed signal.

Weekly chart of GBP vs USD

This is the weekly chart of GBP vs USD. Basically price action suggests a bullish bias. We have a Pinbar at support. A look at USDOLLAR may help establish a bias.

USDOLLAR

Bullish bias for the week.

Weekly chart of USDOLLAR

This is the weekly chart of FXCM USDOLLAR. Price was not able to break the trend line last week. This diminishes the bullish outlook. Price is congested between support and resistance. The two Hammer formations put my bias in favour of the bulls. The analysis of last week (here) is still valid. With a rather strong outlook on USDOLLAR I am not keen on going long GBP vs USD.

Ger30

Bearish bias for the week.

Weekly chart of Ger30

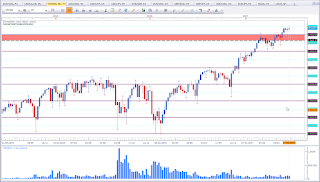
This is the weekly chart of DAX30 / Ger30. Price is at ATHs. We have a toppish looking market structure. Since the last four weeks pice was not able to move higher and kept closing at about the same level. This makes me want to look for short setups. Last week did close as a Shooting Star wich adds weight for the bearish outlook. We may see a correction from current levels. Keep in mind, the trend is bullish, and trends can last longer than anticipated.

SPX500 / S&P 500

Bearish bias for the week.

Weekly chart of SPX500 / S&P 500

This is the weekly chart of SPX500 / S&P 500. We have about the same situation as described above for Ger30. Last week formed a Shooting Star. This puts my bias in favour of the bears.

Thank you for reading. If you have anything to add or any questions, please leave them in the comments section below.

Happy trading,
TT

Mittwoch, 21. Juni 2017

Risk Management and money management are not the same

Today I want to talk about risk management and money management

Many confuse risk management with money management and think both are the same. I don't blame them for confusing both as both limit the position size. But risk managment is more than position sizing. And money management cannot be reduced to position sizing either. Both are an integral part of trading and complement each other. Let me try to demonstrate this.

Before we take a trade, we need to identify the risk that is involved with the trade. That is a must. Only after evaluating the risk and upon deciding in favour of the trade, next we decide, based on our risk and money mangement rules, how big the position size should be. This last sentance demonstrates that risk- and money management can not be seperated.

While my risk management rule may suggest the trade is good to take, my money management may disagree. One of the reasons may be that I already have open positions and the max amount for open positions is already reached.

Or my risk management is not in favour of the trade, even though my money management rule would allow me to take the trade. The risk involved with this new trade may be within my risk and money management parameters (the stop placements allows the trade). And I have more than enough free margin. However, I already have an open positon with the same asset. Or I have an open position that is correlated with this asset. The correlation may be positive or negative, it increases the risk this way or the other. One translates to increasing the risk on the asset, the other means taking a trade counter the open position. Both result in increased risk, which my risk management rule does not allow.

Risk- and money management are mostly considered at the beginning of a trade (risk- and money management are mostly considered for entires). But risk- and money management are important throughout the lifespan of a trade. An open trade is always a risk. The risk is only eliminated upon closing the trade. Some may agrue that we have stops. True! Stops are there to protect us. But there still is slippage. Without really knowing when and where to get out, our trades are vulnerable. Getting out of a trade also involves risk- and moneymangement. Ideally we get a multiple of the initial risk back from our trades. One of our exit management may be to take partial profits at 2r or close the whole trade at 3r, because experience shows that the asset tends to move back once the trade yielded 3r. I am sure many of us have made the experience that as soon you have 200 or 300 pips profit, the market makes a reversal. You possibly would have been alble to squeeze more out, but by rule of thumb anytime your trades reaches 300 pips profit there is a reversal. So you may use this information and have hard take profit at 300 pips profit.

As you can see, risk management and money management are more than just words. While both complemet each other, they are not the same.

Thank you for reading. If you have anything to add or any questions please leave them in the comments section below.

Happy trading,
TT
Montag, 19. Juni 2017

Setups for the week ahead (19.06.-23.06.17)

EUR vs USD

Bearish bias for the week.

Weekly chart of EUR vs USD

This is the weekly chart of EUR vs USD. Price shows signs a of reversal at resistance. This puts my bias in favour of the bears. The bias I had last week is still valid. See here.

CAD vs JPY

Bullish bias for the week.

Weekly chart of CAD vs JPY

This is the weekly chart of CAD vs JPY. Price moved just nicely in favour of my bias last week (here). My bias remains bullish. The 85 level is the next hurdle on the way up to the swing high.

GBP vs CAD

Mixed signal.

Weekly chart of GBP vs CAD

This is the weekly chart of GBP vs CAD. Price is at an interesting level. Currently there is no setup. This level is very  worth to keep an eye on.

AUD vs NZD

Bullish bias for the week.

Weekly chart of AUD vs NZD

This is the weekly chart of AUD vs NZD. Price formed a Morning Star Pattern at support. My bias remains bullish.

EUR vs NZD

Mixed signal.

Weekly chart of EUR vs NZD

This is the weekly chart of EUR vs NZD. Price is at an interesting level. It is worth to keep this asset on the watch list.

NZD vs CAD

Bearish bias for the week.

Weekly chart of NZD vs CAD

This is the weekly chart of NZD vs CAD. Price formed a Bearish Englfing Pattern in the vicinty of the ATHs. This puts my bias in favour of the bears. Keep in mind this is a counter trend bias as the trend is still bullish with successiv higher lows. Price is also on top of a support level. However, price showed signs of weakness as price was not able to form a higher high.

EUR vs JPY

Bullish bias for the week.

Weekly chart of EUR vs JPY

This is the weekly chart of EUR vs JPY. Price seems to have found support at the former highs. I do not really like to take long trades after a run up, but as long support holds, support is valid. And last week formed a Rejection Candle. Six weeks in row failed to violate support. This together with the Rejection Candle puts my bias in favour of the bulls.

USD vs JPY

Bullish bias for the week.

Weekly chart of USD vs JPY

This is the weekly chart of USD vs JPY. The 110 level proved to be support. Price was not able to violate this level 4 weeks ago (Bear Eng Pat). I did talk about this pattern then and mentioned that as long I don't see a violation of the low I am hesistant to take a short trade. It seems the move up was a shift of trend and we should see a violation of previous highs. (Read this here).

GBP vs JPY

Bullish bias for the week.

Weekly chart of GBP vs JPY

This is the weekly chart of GBP vs JPY. Price is in the middle of the range. I do not really like to trade in mid range levels. However, the level is sound and we have a Rejection Candle. This may be the first sign of the continuation of an up trend which manifests itself in form of a higher low.

EUR vs GBP

Bearish bias for the week.

Weekly chart of EUR vs GBP

This is the weekly chart of EUR vs GBP. Price formed a Tweezers Top with a Shooting Star as the second Candle at resistance. This is puts my bias in favour of the bears.

NZD vs USD

Bearish bias for the week.

Weekly chart of NZD vs USD

This is the weekly chart of NZD vs USD. Last week formed a Rejection Candle at Resistance. I would have prefered to have this pattern closer to resistance, but we have to work with what we get. Together with the rather weak NZD (more about this in the Cross Currency Analysis) my bias is in favour of the bears.

NGAS

Bullish bias for the week.

Weekly chart of NGAS

This is the weekly chart of NGAS. We have two successive rejections of the 3,0 level. This puts my bias in favour of the bulls

GBP vs NZD

Bullish bias for the week.

Weekly chart of GBP vs NZD


This is the weekly chart of GBP vs NZD. Price is at an interesting level. Price is on top of a congestion zone to the left and on top of the 0,75 level. Last week formed a small Rejection Candle. This together with a weak outlook of the NZD puts my bias in favour of the bulls.

USDOLLAR

Bullish bias for the week.

Weekly chart of USDOLLAR

This is the weekly chart of FXCM USDOLLAR. The trend is still bullish. Up to this date the move down is a pullback. Last week may have marked the end of the pullback. The micro structure of the pullback established a trend. But we need to keep an eye on the big picture, which is still bullish. We need a violation of aproximately 11,60 level to talk about a trend shift. If you look closely to the chart, I marked a falling Trendline. A conservative approach would be to wait for a violation of the trendline.

Cross Currency Analyis

All the analysed pairs which have NZD either as base or quote currency show weakness in favour of NZD. If NZD was strong, we would not see throughout weakness as described. USD and GBP are the strongest pairs for the week. The USDOLLAR Chart above adds weight to the strong outlook of USD.

JPY is weak throught the analyzed assets, which makes NZD and JPY the most favourable single currencies to look for shorting. A look at NZD vs JPY should help to pick the weaker one.

Weekly chart of NZD vs JPY

This is the weekly chart of NZD vs JPY. There is no sign of a reversal but a continuation of the bullish move. The close above the 80 level adds weight in favour of the bulls. This makes the JPY the favourable currency to look to short.

Thank you for reading. If you have anything to add or any questions, please leave them in the comments section below.

Happy trading,
TT

Sonntag, 11. Juni 2017

Setups for the week 12.06.-16.06.17

EUR vs USD

Bearish bias for the week.

Weekly chart of EUR vs USD

This is EUR vs USD weekly chart. Price formed a Dark Cloud Cover at the red line. This puts my bias in favour of the bears. The chart above clearly illustrates the big range this pair is in. I was expecting a test of range resistance. We still may see the test. But with the bearish formation my bias is bearish for the week. I am expecting a pullback which may test the 1,10 level.

EUR vs CAD

Bearish bias for the week.

Weekly chart of EUR vs CAD

This is EUR vs CAD weekly chart. Price made a stong move up from around 1,40 and is currently showing signs of exhaustion. Last week formed a Dark Cloud Cover at a restistance level. This puts my bias in favour of the bears. I am aware of the support zone around the 1,50 level. Price may range at current levels.

AUD vs CAD

Bullish bias for the week.

Weekly chart of AUD vs CAD

This is AUD vs CAD weekly chart. Price formed a Morning Star Pattern with last week. This puts my bias in favour of the bulls for the week. It seems we may see a test of the yellow zone. There is still enough space to resistance from current levels, so looking for long setups is viable.

CAD vs JPY

Bullish bias for the week.

Weekly chart of CAD vs JPY

This is CAD vs JPY weekly chart. Price is in a small range and formed a Pinbar. Unfortunately the Pinbar did not form at range support, but touched the support level with the wick. This makes the pinbar less favourable. It confirms there is support at lover levels. The 90 is a key level. Above 90 I am bullish. 

GBP vs CAD

Bearish bias for the week.

Weekly chart of GBP vs CAD

This is GBP vs CAD weekly chart. The parliamentary elections devalued the GBP pretty strong. Last week formed a Bearish Outside Bar/Candle. This is a bearish continuation pattern. This formation puts my bias in favour of the bears. However, be aware of support at the 1,70 level. We may see a test of 1,70. A close below will add more bearishness.

AUD vs NZD

Mixed signal.

Weekly chart of AUD vs NZD

This is AUD vs NZD weekly chart. Price is at an interesting level. Basically I am bearish below 1,05, however price is right on top of support. Last week candle did close as an Inverted Hammer. The issue I have with this candle is, it may also be a rejection candle of 1,05 as that level was significant in the past. Only the weekly close will cofirm the bulls or bears. I am inclined to treat last week candle as a bullish candle, as price is right at support.

Gold

Weekly chart of Gold

This is Gold weekly chart. I have recently put Gold and Silver on my watch list. Price has all signs of a bullish trend with higher highs and higher lows. The last attempt to form a higher high however failed. Last week closed as a Rejection Candle which engulfs the previous bull candle. This puts my bias in favour of the bears.

GBP vs USD

Mixed signal.

Weekly chart of GBP vs USD

This is GBP vs USD weekly chart. Price formed a Bearish Outside Candle. This is a bearish continuation siganal. Base on this signal I am bearish. However, price closed right on top of support, which diminishes the bearishness and makes me want to see more bearish signs. If I needed to take a short trade, I would opt for EUR vs USD. That pair seems the better candidate for shorts.

Silver

Bearish bias for the week.

Weekly chart of Silver

This is Silver weekly chart. Last week close confirms the Hanging Man (previous candle) and forms at the same time a Bearish Engulfing Pattern. I would have preferred a close below the wick of the Hanging Man, but we do not always get what we want. 

EUR vs JPY

Mixed signal.

Weekly chart of EUR vs JPY

This is EUR vs JPY weekly chart. Price is makeing higher highs, but shows struggle to push above 125. Price made about 1.000 Pips with three candles and seems to have run out of steam. The bearish close last week puts my bias in favour of the bears. Being at support it seems we may see price ranging at this level to resume some energy. Last week formed a Bearish Engulfing Pattern, which puts my bias in favour of the bears, but I am ready to go both ways, as price is at support.

USD vs JPY

Bullish bias for the week.

Weekly chart of USD vs JPY

This is USD vs JPY weekly chart. Price formed a Pinbar at 110 level. This puts my bias in favour of the bulls. I did talk about this asset two weeks ago. See here. Price was not able to close below the Bearish Engulfing Pattern but formed a Pinbar at right at the wick of it. 

AUD vs USD

Bullish bias for the week.

Weekly chart of AUD vs USD

This is AUD vs USD weekly chart. Price is inside a big range. It seemed as if price was forming a bearish trend inside the range indicating a test of range support. However, price was able to close above the 0,75 level and the congestion zone marked with the small rectangel inside the big rectangle, This puts my bias in favour of the bulls. 

EUR vs AUD

Bearish bias for the week.

Weekly chart of EUR vs AUD

This is EUR vs AUD weekly chart. Price formed a Bearish Engulfing Pattern at a level of interest. This together with the close below 1,50 puts my bias in favour of the bears.

EUR vs GBP

Mixed signal.

Weekly chart EUR vs GBP

This is EUR vs GBP weekly chart. Price formed an Indecision Candle (High Wave Candle) at a level of interest. It is worth to keep an eye on this pair.

USD vs CAD

Mixed signal.

Weekly chart of USD vs CAD

This is USD vs CAD weekly chart. Bascally I am bearish below 1,35. But price is in a congestion zone. This puts my bias neutral until I see a breakout. Usually a Breakout will lead to a nice move. Price recently broke a resistance level and made a new high. Now price is back at the former resistance level and testing it now as support. 

NGAS

Mixed signal.

Weekly chart of NGAS

This is NGAS weekly chart. Price is sitting on top of a support level wich is in confluence with the 3,0 level. It is very worth to keep an eye on this level. 

Cross Currency Analysis

The three strong single currencies are USD, AUD, and CAD.

The EUR seems to be the weakest pair throughout the analyzed assets. While I have a rather bearish bias for EUR vs USD my bias is mixed on GBP vs USD. Looking at the USDOLLAR should help making a decision. USDOLLAR formed a Pinbar at support which is a bullish pattern. Putting these three together, I would rather look to short EUR vs USD rather than GBP vs USD. 

The USD and AUD are about the strongest currencies. That makes trading AUD vs USD less favourable. But a good pair to trade would be EUR vs AUD.

Among all JPY pairs I favour USD vs JPY the most. 

There is so much more to write about, but I think I did cover the most essential ones without making it too complicated. I like my thoughts to be like my charts. Simple and clean.

Thank you for reading. If you have any questions or would like to add your thoughts, please leave them in the comments section below.

Happy trading,
TT