Posts mit dem Label Setups for the week ahead werden angezeigt. Alle Posts anzeigen

Sonntag, 13. Mai 2018

Setups for the week ahead 14.05.-18.05.18

EUR vs USD

Bullish bias for the week.
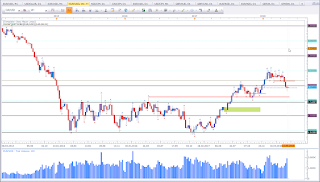
Weekly chart of EUR vs USD
EUR vs USD W1
This is the weekly chart of EUR vs USD. Last week close formed a Hammer at support. This is a bullish reversal pattern. In the monthly analysis, I did talk about this asset. I did mention, that I'd like to see a correction red horizontal line. However, due to the support level price is sitting there was no clear bias. See here for last month analysis. Having a weekly Pinbar at support puts my bias in favour of the bulls.
At this point, I'd like to draw your attention to two of my articles one about Pinbars the other about stop hunting.

EUR vs CAD

Mixed signal.

Weekly chart of EUR vs CAD
EUR vs CAD W1
This is the weekly chart of EUR vs CAD. I did mention the 1,50 level in the monthly analysis (see here). The weekly timeframe shows support more clear. And we see signs of reaction at support. The signs are not sufficient enough to switch the bias, but it is well worth to keep an eye on this asset and the level price is sitting at.

NZD vs JPY

Mixed signal.
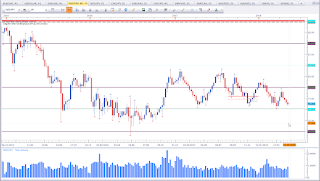
Weekly chart of NZD vs JPY
NZD vs JPY W1

This is the weekly chart of NZD vs JPY. Price is sitting at an interesting level. This asset is hitting the current support level the fourth time now. This shows, this level is significant. Either this level holds or it breaks. One thing about support and resistance levels is they are stronger if they got tested a couple times. Eventually they will give in and fail. We never know before hand. Currently support is holding and we have an Indecision Candle at support. However, the structure of the market shows bearish pressure with successive lower highs. It may be worth to keep an eye on this asset in the near future.

Gold

Weekly chart of Gold
Gold W1
This is the weekly chart of Gold (XAU vs USD). Price is trapped between 1350 and 1300. The million dollar question is, which level is going to fail? The monthly bias is bearish. Currenlty the weekly bias does not confirm the monthly bias. I'll keep may hands on my lap, wait, and observe patiently. I am not interested in trading range support, price is sitting at.

GBP vs USD

Mixed signal.

Weekly chart of GBP vs USD
GBP vs USD W1
This is the weekly chart of GBP vs USD. Price formed an Indecision Candle at a level of interest. Recent Dollar strength did break the most recent higher low. This may be the sign for a continuation of the bear trend. We'll only know once price moved. For now, we see Indecison at support. This is not enough for me to establish a bullish bias, hence I'll wait and observe. A close above or below will shed more light.

USDOLLAR

Bearish bias for the week.
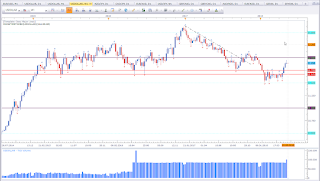
Weekly chart of USDOLLAR
USDOLLAR W1
This is the weekly chart of FXCM USDOLLAR. Last week did close as a Shooting Star at a level of interest. We may see a test of the red horizontal line.

AUD vs USD

Bullish bias for the week.

Weekly chart of AUD vs USD
AUD vs USD W1
This is the weekly chart of AUD vs USD. Last week did close as a Hammer at a level of interest. A Hammer is a bullish reversal pattern. This puts my bias in favour of the bulls.

GBP vs AUD

Bullish bias for the week.

Weekly chart of GBP vs AUD
GBP vs AUD W1
This is the weekly chart of GBP vs AUD. Price formed a Gravestone Doji, which could be classified as the ultimate Inverted Hammer. A Doji is a reversal pattern. An Inverted Hammer is a bullish reversal pattern. What I do not like about Inverted Hammers is, these can also be classified as Rejection Candles at the same time. Here, we have higher highs and higher lows, which is a bullish trend. This is why I label last week candle an Inverted Hammer. This formation also formed at support. What I see is a bullish reversal pattern in a bullish trend at support. Hence, my bias is bullish.

AUD vs CAD

Bullish bias for the week.

Weekly chart of AUD vs CAD
AUD vs CAD W1
This is the weekly chart of AUD vs CAD. Price is at a level of interest and formed a bullish reversal pattern called Hammer. This puts my bias in favour of the bulls.

GBP vs CAD

Mixed signal.

Weekly chart of GBP vs CAD
GBP vs CAD W1
This is the weekly chart of GBP vs CAD. Price did close as an Indecision Candle at support. Some might call last week candle an Inverted Hammer. It is not really important how you lable candles, what is important is, what do the candles tell me. Price is at a level of interest. If price is not able to violate this level, than we have a bullish sign. Currently we see price is rejecting 1,75 but failed to violate support. Next week close will shed more light.

A word of caution. Last week close have formed many Pinbars. Those who trade only pinbars must be happy as there are many opportunities to trade pinbars. But not all Pinbars are a guaranteed success. Please read my article about pinbars (here).

Cross Currency Analysis

With a weak bias on USD, chances have increased in favour of a bullish reversal on EUR vs USD, GBP vs USD, and AUD vs USD.

Since there have been some assets with a rather strong bias in favour of AUD, I'd be carefull with GBP vs AUD.

If you have questions or would like to give feedback, please leave them in the comments section below.

Happy trading,
TT

Sonntag, 8. April 2018

Setups for the week ahead 09.04.-13.04.18

This is the first weekly setup for this year. I have been too busy to keep up with the weekly setups. Below I'll share my thoughts on select assets leaning on the monthly (see here).

EUR vs CAD

Bearish bias for the week.

Weekly chart of EUR vs CAD
EUR vs CAD W1
This is the weekly chart of EUR vs CAD. The significance of the 1,60 level is clearly seen on this chart. Price did close above the 1,60 level and immediately corrected more than 500 Pips. The close below the grey box catches my attention. This is an early sign I that we may see a correction. The close below the box puts my bias in favour of the bears for the week. 

NZD vs JPY

Bullish bias for the week.

Weekly chart of NZD vs JPY
NZD vs JPY W1
This is the weekly chart of NZD vs JPY. Price did react at support. There is some resistance (red horizontal line to the left). If price clears that level, that will be a healthy sign for the bulls. 

USD vs CAD

Bearish bias for the week.

Weekly chart of USD vs CAD
USD vs CAD W1
This is the weekly chart of USD vs CAD. Price shows reaction at the 1,30 level. Previously we had a Dark Cloud Cover signal, which is a bearish reversal pattern. Price did halt for a week. With last week close we had the follow through. The close below the Mother Candle puts my bias in favour of the bears. However, keep in mind that price did make a new high, which basically is a bullish sign. We need to take everything into consideration. The markets talk to us, it is up to the trader to listen. Immediate structure is bulish, with a high followed by a higher low, than having a higher high. We may see a correction to the 1,25 level. We have to evaluate as time and price progress.

NZD vs CAD

Bullish bias for the week.

Weekly chart of NZD vs CAD
NZD vs CAD W1
This is the weekly chart of NZD vs CAD. Counter the the rejection of the 0.95 level mentioned in the monthly analysis, the weekly shows a reaction at support (red dashed line). Price did break resitance, came back and gets rejected. This is a bullish sign, hence my bias is bullish for the week. This does not mean I am looking to buy this asset. This analysis helps me to manage my positions. I am aware of the monthly Rejection Candle. 

Thank you for reading. If you have any questions or would like to give feedback, please leave them in the comments section below. 

Happy tradig,
TT

Sonntag, 10. Dezember 2017

Setups for the week ahead 11.12.-15.12.17

EUR vs CAD

Bullish bias for the week.

Weekly chart of EUR vs CAD
EUR vs CAD W1
This is the weekly chart of EUR vs CAD. Last week failed to violate the 1,50 level and formed a Rejection Candle. This puts my bias in favour of the bulls.

XAU vs USD

Bearish bias for the week.

Weekly chart of XAU vs USD
XAU vs USD W1
This is the weekly chart of Gold. Price did break the higher low to the downside and made a close below 1.250. This puts my bias in favour of the bears. We have the beginning signs of a trend shift.

USDOLLAR

Bullish bias for the week.

Weekly chart of USDOLLAR
FXCM USDOLLAR
This is the weekly chart of FXCM USDOLLAR. Last week close did complete the Morning Star Pattern. This is a bullish reversal pattern. But what's more important is, the question wheather this asset built a higher low. At the moment it appears like the establishment of a higher low. The close above the 12 level puts my bias in favour of the bulls. I am not trading this asset, but I like to use this asset to establish trading ideas on other assets such as EUR vs USD etc.

EUR vs USD

Mixed signal.

Weekly chart of EUR vs USD
EUR vs USD W1
This is the weekly chart of EUR vs USD. This asset is in a bullish trend. Currently we don't know if the pullback is over and we'll see a continuation of the bullish trend. We may also see the beginning signs of a trend shift followed by a deeper correction (or even a trend change). Last week did complete the Evening Star Pattern, which is a bearish reversal pattern. This asset made about 1.500 pips without really a pullback since April this year. With a bullish Dollar bias, chances are in favour of the Evening Star Pattern on this asset. Time will tell. I still would like to see a test of the black horizontal line, ideally of the green rectangle.

Ger30

Bullish bias for the week.

Weekly chart of Ger30
Ger30 W1

This is the weekly chart of Ger30/DAX30. Last week did close as a Bullish Engulfing Pattern at a relevant level. This is not an ideal Bullish Engulfing Pattern is the engulfing pattern failed to close above the previous candle. However, the pattern is valid and it is at a relevant level. We trade what we see. And that is a bullish pattern at a level of interest. Additionally we have a closing price above the 13.000 level. All this puts my bias in favour of the bulls.

Copper

Bearish bias for the week.

Weekly chart of Copper
Copper W1
This is the weekly chart of Copper. This asset is in a bullish trend. However, my bias for the week ahead is counter the prevailing trend. Price did close the first time below a higher low. This catches my attention. This is not a shift of trend yet.

USD vs CHF

Bullish bias for the week.

Weekly chart of USD vs CHF
USD vs CHF W1
This is the weekly chart of USD vs CHF. Price formed a Bullish Engulfing Pattern at a level of interest. See to the left, you'll see a break of a lower high. Price did pull back to this level and formed a bullish reversal pattern. This puts my bias in favour of the bulls. Additionally, the USDOLLAR Index (FXCM USD Index) also suggests bullishness. Basically below parity I would rather maintain a neutral of negative biase, but market structure suggests bullishness.

EUR vs GBP

Mixed signal.

Weekly chart of EUR vs GBP
EUR vs GBP W1

This is the weekly chart of EUR vs GBP. I was debating with myself whether or not to list this asset. As you can tell, I decided in favour of the latter. Price is in a narrow trading range, which I like to call a congestion zone. It is not advised to trade inside the congestion. However, I like how last the week Rejection Candle formed right on top of support. This suggests strength at this level. A close below the lower red horizontal line would negate this putative strength.

AUD vs CAD

Bullish bias for the week.

Weekly chart of AUD vs CAD
AUD vs CAD W1
This is the weekly chart of AUD vs CAD. This is an asset that likes to wick a lot. So keep this in mind trading AUD vs CAD. Price shows resistance to move south. Last week did close as a Rejection Candle. Price tried to violate the swing low but failed to do so. This puts my bias in favour of the bulls.

It seems the week ahead will be an interesting one. USD appears to be the srongest asset for the week ahead. Many trading opportunities do not necessarily mean to take many trades. I hope you find my weekly analysis useful in your journey as a trader.

If you have any questions or feedback please leave them in the comments section below.

Happy trading,
TT

Sonntag, 3. Dezember 2017

Setups for the week ahead 04.12.-08.12.2017

EUR vs CAD

Bearish bias for the week.

Weekly chart of EUR vs CAD
EUR vs CAD W1
This is the weekly chart of EUR vs CAD. Last week did close as a Shooting Star. The week did close with good CAD news. Price failed to break the swing high. This puts my bias for the week ahead in favour of the bears. Price is testing the resistance level. I am not inclined to look for short opportunities above 1,50. As long price is above 1,50 I am willing to give the market the chance to break resistance.

NZD vs JPY

Mixed signal.

Weekly chart of NZD vs JPY
NZD vs JPY W1

This is the weekly chart of NZD vs JPY. Price shows all signs of a trend shift with a lower high and a lower low. There is a good chance we may see a test of the 75 level. That is the next critical level. But there is no bearish weekly setup, hence the label "mixed signal." It is weel worth to keep an eye on this asset. I'll get more interested once price gets closer to the critical level.

AUD vs NZD

Bullish bias for the week.

Weekly chart of AUD vs NZD
AUD vs NZD W1
This is the weekly chart of AUD vs NZD. Last week did close as a Hammer. This is a bullish reversal pattern. I did talk about this asset and some other Aussie related pairs last week (see here).

US Oil

Mixed signal.

Weekly chart of US Oil
US Oil W1

This is the weekly chart of US Oil. There is no setup as of yet. But price is approaching an interestig level. That's why this asset is listed here. Last week did close as a Hanging Man, which is a bearish reversal pattern. However, a Hanging Man needs to get confirmed. I personally do not like trading Hanging Man formations, cause these can also be interpreted as a bullish pattern representing a rejection of lower prices. Count three candles back and you see a nice Hanging Man formation. That's why we need to wait for confirmation of a Hanging Man. For now, all I care is the level. And the level is interesting.

If you have feedbacks or any questions, please leave them in the comments section below.

Happy trading,
TT

Sonntag, 26. November 2017

Setups for the week ahead 27.11.-01.12.17

NZD vs JPY

Mixed signal.

Weekly chart of NZD vs JPY
NZD vs JPY W1
This is the weekly chart of NZD vs JPY. Price did break a swing low and is about to test the next swing low. The 75 level is a level of interest. As price approaches this level it catches my interest. That's why this asset is listed here.

AUD vs NZD

Mixed signal.

Weekly chart of AUD vs NZD
AUD vs NZD W1
This is the weekly chart of AUD vs NZD. Price did form an Outside Bar (and a Bullish Engulfing Pattern). Basically the Outside Bar is a continuation pattern. Here it would be a reversal signal. I do not really differentiate between an engulfing pattern or an outside bar. What counts is the engulf. But here the Bullish Engulfing Pattern is not confirming. We have two narrow candles. However, the market likes to test levels. The next relevant level is marked with the two red horizontal lines and is resting at a level of interest. The trend is bullish with a series of higher highs and  higher lows.

EUR vs JPY

Mixed signal.

EUR vs JPY W1
This is the weekly chart of EUR vs JPY. This asset is still trading inside the narrow congestion zone. It is well worth to keep an eye on this asset.

AUD vs CAD

Mixed signal.

Weekly chart of AUD vs CAD
AUD vs CAD W1
This is the weekly chart of AUD vs CAD. Price is at an interesting level. Price attempts to break a swing low but failed so far. We see a test of a level of interest. Last week closed as an Indecision Candle. This catches my interest. 

NZD vs CAD

Mixed signal.

Weekly chart of NZD vs CAD
NZD vs CAD W1
This is the weekly chart of NZD vs CAD. Price failed to break the swing low and is at a level of interest. It is worth to keep an eye on this asset as well.

Cross-Currency-Analysis

AUD vs CAD and NZD vs CAD are at a level of interest. There are no setups yet, but if you plan to trade any of these pairs, you might want to look at AUD vs NZD first. AUD vs NUD did print a Bullish Outside Bar, which is a bullish signal. Hence AUD appears stronger compared  to NZD. So if I were to trade any of these two assets, I'd put more focus on AUD vs CAD.

If you have any questions or would like to give feedback, please leave them in the comments section below.

Happy Trading,
TT

Sonntag, 19. November 2017

Setups for the week ahead 20.11.-24.11.17

EUR vs USD

Mixed signal.

Weekly chat of EUR vs USD
EUR vs USD W1
This is the weekly chart of EUR vs USD. Basically we have a bullish setup with a modified Morning Star Pattern. However, price was not able to close above the big bearish candle, which keeps me alert. I'll keep an eye on this asset. Maybe we will not see the test of the black horizontal line that I would love to see. A look at the Dollar Index might give some clues.

USDOLLAR

Mixed signal.

Weekly chart of USDOLLAR
USDOLLAR W1
This is the weekly chart of FXCM USDOLLAR Index. Price formed an Indecision Candle at a level of interest. This may indicate potential strength. The 10 level proves to be relevant again. As long price is not able to violate the 10 level, the bias will remain mixed to bullish. This diminishes the potential bullish outlook on the asset above (EUR vs USD).

EUR vs CAD

Mixed signal.

Weekly chart of EUR vs CAD
EUR vs CAD W1
This is the weekly chart of EUR vs CAD. With the fifth attempt price managed to close above the 1,50 level. This is basically bullish. However, resistance at 1,5250 level is not far. Hence the label "mixed signal".

EUR vs NZD

Bullish bias for the week.

Weekly chart of EUR vs NZD
EUR vs NZD W1
This is the weekly chart of EUR vs NZD. Price performed a strong bounce of a support level (red parallel lines) and a close above the 1,70 level. This puts my bias in favour of the bulls. We have all indications of a strong market. 

EUR vs JPY

Mixed signal.

Weekly chart of EUR vs JPY
EUR vs JPY W1
This is the weekly chart of EUR vs JPY. Price is in a congestion zone. This catches my attention. Once price breaks out, it will move far. So stay alert on this asset. Last week did close as a Rejection Candle. But I don't put much emphasis on the last week candle. Price is still above support (red horizontal line). As an aggressive approach, I'd like to see a close above or below the black dottet lines. Price has moved about 2.000 Pips without a pullback. This is not a guarantee for a move south, but it is something to consider if you want to trade support.

EUR vs AUD

Mixed signal.

Weekly chart of EUR vs AUD
EUR vs AUD W1
This is the weekly chart of EUR vs AUD. Price made a strong close above the 1,55 level. Price formed an ascending triangle that got broken at the same time. This is a bullish signal. However, price stopped at a level of interest. We may see a pause/reaction at the current level.

If you have any questions or feedback please leave them in the comments section below.

Happy trading,
TT

Sonntag, 12. November 2017

Setups for the week ahead 13.11.-17.11.17

EUR vs USD

Mixed signal.

Weekly chart of EUR vs USD
EUR vs USD W1
This is the weekly chart of EUR vs USD. Price is testing the red support level. But we have the beginning signs of a trend shift. I am not interested in bullish setups. Last week failed to violate the previous high. What I said last week about this asset remains valid. See here for last week analysis on this pair.

CAD  vs JPY

Mixed signal.

Weekly chart of CAD  vs JPY
CAD  vs JPY W1
This is the weekly chart of CAD  vs JPY. Price is at an interesting level. Last week did close as a Doji. On a lower timeframe price is testing the bottom of a range level. Either this pair formed a lower high, or we see a violatin of the last week low, which would be a violation of the support level created by the previou swing high that price is testing currently. Either way, this is an interesting asset to keep an eye on.

AUD vs NZD

Mixed singal.

Weekly chart of AUD vs NZD
AUD vs NZD W1
This is the weekly chart of AUD vs NZD. Price is at a level of interest. It is worth to keep an eye on this asset. Price has made successive higher highs and may now form the next higher low.

EUR vs NZD

Bullish bias for the week.

Weekly chart of EUR vs NZD
EUR vs NZD W1
This is the weekly chart of EUR vs NZD. Price formed a Hammer at a level of support. Some traders may call this a Hanging Man since price has moved up already. But we are making higher highs and higher lows. And recently we had a violation of a previous high that got tested now (see the two red horizontal lines). We have an established bullish trend and price is giving a bullish signal at a level of interest. This puts my bias in favour of the bulls.

If you have any questions or feedback, please leave them in the comments section below. 

Happy trading,
TT

Montag, 6. November 2017

Setups for the week ahead 06.11.-10.11.17

EUR vs USD

Bearish bias for the week.

Weekly chart of EUR vs USD
EUR vs USD W1
This is the weekly chart of EUR vs USD. Price did violate support and last week formed an Indecision Candle inside the previous one. The upper wick shows rejection of the previous support level. I am not keen on trading this asset. I want to see a test of the black horizontal line or better a test of the green rectangle. These are my target areas to look for setups.

XAU vs USD

Mixed signal.

Weekly chart of XAU vs USD
XAU vs USD W1
This is the weekly chart of Gold. Price is at an interesting level. We are now at a decision point. A violation below the green zone is bearish. A bullish weekly close would be signs of strenght. I need to reevaluate at the end of the week. We may see interesting moves soon.

EUR vs JPY

Mixed singal.

Weekly chart of EUR vs JPY
EUR vs JPY W1

This is the weekly chart of EUR vs JPY. Price appears to top out. The trend is bullish, however the bulls appear to run out of steam. We may see a correction of the last leg up.

I hope you enjoy the weekly setups. If you have any questions or feedback. please leave them in the comments section below.

Happy trading,
TT

Sonntag, 22. Oktober 2017

Setups for the week ahead 23.10.-27.10.17

EUR vs USD

Mixed signal.

Weekly chart of EUR vs USD
EUR vs USD W1
This is the weekly chart of EUR vs USD. Price was not able to violate support, nor was price able to break the top of the Bullish Engulfing Pattern. Last week closed as an Inside Candle. Price is indecisive at a level of interest. Personally I would like to see price move south to test the previous range level (black horizontal line). But we do not always get what we want. As traders we have to work with what we see. And that is currently Indecisive at support. As long support holds, treat support as support. I do not need to be in a trade, so I am fine waiting another week or two for a good setup to trade. A look at the Dollar Index will help me in the decision making process.

EUR vs CAD

Bullish bias for the week.

Weekly chart of EUR vs CAD
EUR vs CAD W1
This is the weekly chart of EUR vs CAD. I was talking about this asset the previous week (see here) and the price only took of last week unfortunately without me. Having established a bullish bias does not necessarily mean I am going to buy this asset. It also means I am going to avoid to sell this asset. Having a bias reduces the vast amout of trading opportunities, which may prove to be essential.

CAD vs JPY

Mixed signal.

Weekly chart of CAD vs JPY
CAD vs JPY W1
This is the weekly chart of CAD vs JPY. Price formed the 3rd Indecision Candle in a row at a level of interest. The last candle could classify as a High Wave Candle. As you can see by the black dotted lines, price failed to violate the first Indecision Candle (on a weekly basis).

AUD vs NZD

Mixed signal.

Weekly chart of AUD vs NZD
AUD vs NZD W1
This is the weekly chart of AUD vs NZD. Basically the structure is bullish. If price had not been this close to the resistance level marked with the red line, I'd have labeled this asset as bullish. Price is making higher highs and higher lows. This is the classic definition of a bullish trend. Price is now approaching about the fourth time this level. Either we'll see a violation or a bounce. Only time will tell. This asset is very interesting. Keep an eye on this one.

EUR vs NZD

Mixed signal.

Weekly chart of EUR vs NZD
EUR vs NZD W1
This is the weekly chart of EUR vs NZD. This asset is quite interesting. Notice how last week did violate the previous Pinbar. That was a nice beatish setup. But it failed (mainly because of NZD news). If you have not read my article about Pinbars, you can find it here. This asset shows the classi signs of a bullish trend i.e. a series of higher highs and higher lows. This basically this puts my bias in favour of the bulls, hence I'll avoid shorting this asset. But price is approaching a level of interest and we may see a reaction here.

USDOLLAR

Mixed signal.

Weekly chart of USDOLLAR
USDOLLAR W1
This is the FXCM Dollar Index. The question that arises now is, did we form a lower high? Price was not able to violate the 12 level and formed a Piercing Pattern at a previous congestion area. At this moment, I don't give the Piercing Pattern (bullish formation) much value. If we are going to see USD strength, price has to break and close above the 12 level. Below the 12 level I tend to be neutral or bearish. Unfortunately this asset is not helpful to evaluate EUR vs USD. I am not rather neutral to bearish this asset.

DAX 30

Mixed singal.

Weekly chart of DAX 30
DAX 30 W1
This is the weekly chart of DAX 30 (FXCM Ger30). Price did form the second Doji in a row. Hence this asset did catch my attention. The trend is bullish, so I am not keen on counter trend trading this asset. But I'll keep a keen eye on this for potential setups. A close below the Doji would be a bearish signal.

EUR vs JPY

Bullish bias for the week.

Weekly chart of EUR vs JPY
EUR vs JPY W1
This is the weekly chart of EUR vs JPY. Last week I did talk about this asset and mentioned I'd like to see a close above the two Indecision Candles. I also talked about the Tombstone Doji. (click here).
Last week candle engulfs the two previous candles. And this happens at a level of interest in a bullish trend. This puts my bias in favour of the bulls. But price is very close at the swing high which can act as resistance.

Copper

Bearish bias for the week.

Weekly chart of Copper
Copper W1

This is the weekly chart of Copper. Price formed a Shooting Star at a previous trouble area and the swing high. This puts my bias in favour of the bears.

Hope you enjoy my weekly analysis. If you have any queations or feedback please leave them in the comments section below.

Happy trading,
TT