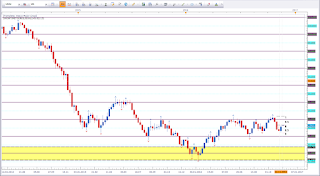
EUR vs USD
Mixed signal.
Price made a strong move south the last two weeks. This is a bearish sign. But price is now at range support as highlighted in the chart above. At this point it is not possible to define a setup. Only the weekly close will shed more light. As long support has not been violated, I'll take support as support.
EUR vs CAD
Mixed signal.
Simmilar picture as EUR/USD. EUR/CAD made a strong move south, which is a bearish sign. However, price is at support. The range is not as extended as EUR/USD though. The weekly close will shed some light.
AUD vs CAD
Bearish bias for the week.
Price made a strong move south and closed below parity. This sets my bias in facour of the bears. I will keep an eye for setups on retracements.
CAD vs JPY
Bearish bias for the week.
Price did break the recent two highs and closed above 80. This puts my bias in favour of the bulls. However, price did close right at the previous swing low, which may be a test of resistance. The trend is bearish and we may be at an interesting level for a bearish continuation.
GBP vs CAD
Bearish bias for the week.
Price bounced off the 1,70 level and formed a Bearish Engulfing Pattern.
EUR vs NZD
Mixed signal.
Basically I have a bullish bias on this asset. But because of a missing signal I label this pair as mixed signal for the week. Price is at range support just like the other mentioned EUR pairs. Additionally, price was not able to close below the 1,50 level.
NZD vs CAD
Berish bias for the week.
Price formed new ATHs but closed below 0,95. We may be at the start of a new cycle down. The trend however remains bullish as of now.
GBP vs USD
Bearish bias for the week.
A Bearish Engulfing Pattern closing below 1,25 sets my bias in favour of the bears.
Ger30 / DAX30
Bearish bias for the week.
Last week formed a tiny candle. The shape looks like a pinbar. However, I won't refer to this candle as a pinbar. A pinbar needs a longer wick, even though the upper wick is at least double the size of the body. We have an indecision candle at range resistance, which puts my bias in favour of the bears. As long price is not able to violate and close above the recent highs, my bias is bearish. In my last post I was referring to these highs as resistance (here).
EUR vs JPY
Mixed signal.
Basically I am bullish above 115. However, price is at resistance highlighted in yellow.
USD vs JPY
Mixed signal.
Basically I am bullish this pair. However, price is not at a recent high. And the strong move up makes me expect some kind of retracement. I am not interested to go long at this point.
GBP vs JPY
Mixed signal.
We have a strong move up and a rather strong close above 135, which is bullish. However, price is aproaching a resitance level. And the trend is bearish.
AUD vs JPY
Mixed signal.
All the JPY pairs picture about the same image. However, this asset shows clear that price is having problems moving higher. Basically I am bullish above 80. But the resistance level that prive is not able to break gives me a bearish taste. As long price is not able to close above resistance, I am bearish.
USD vs CHF
Bullish bias for the week.
Price broke resisance level and closed above parity.
AUD vs USD
Bearish bias for the week.
Price did bounce off the resistance level and broke the trendline. We have a strong close below 0,75. I'll look for short opportunities on pullbacks.
NZD vs USD
Mixed signal.
Price is at an interesting level. We have bearish signs. Bounce of resistance, followed by a break of the trendline. However, price was not able to violate the 0,70 level. There is no setup as of now, but the level is interesting. The weekly close will tell us more.
GBP vs CAD
Mixed signal.
Basically I am bearish. But there is not setup as of yet. We have a Hanging Man formation which needs to get confirmed. The downside of any Hanging Man formation is, they can be regarded as rejection candles as well. Here price is rejecting 1,65. However, price is at a resistance level and formed a Hanging Man. The weekly close will shed some light.
US Oil
Bullish bias for the week.
The Bullish Engulfing Pattern closing above 45 puts my bias in favour of the bulls. We have a bounce of the most recent low which may be the first sign of range support. Range resistance is at 50.
GBP vs NZD
Mixed signal.
We had a strong move back to former ATLs. The strong move north is a bullish sign. However, we are at resistance. The former ATLs should act as strong resistance. The weekly close will shed some light.
Happy trading,
TT


Keine Kommentare:
Kommentar veröffentlichen