EUR vs USD
Bullish Bias for the week.
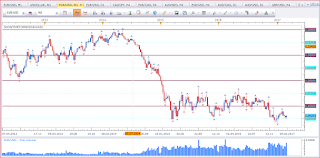
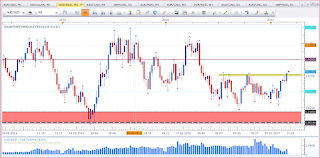
This is EUR vs USD weekly timeframe. We have three successive candles with rather long lower wicks, which shows rejection of lower prices. The current level of 1,05 forms the range support which price seems to confirm. This puts my bias in favour of the bulls.
EUR vs CAD
Mixed signal.
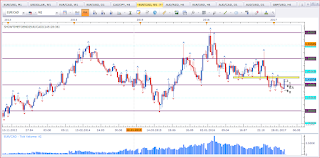
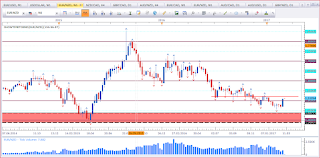
This is EUR vs CAD weekly timeframe. Basically I am bullish this pair with the strong Bullish Engulfing Pattern. However, price moved strongly and is at the vicinitiy of resistance. A weekly close above the resistance level would be a healthy bullish sign. But for now, price can go both ways. At resistance I'll keep my eyes open for signs of weakness. The closer we get to the 1,40 I'll keep my eye open for signs of strength. As long price stays in between support and resistance, these levels will hold until broken.
AUD vs CAD
Bullish bias for the week.
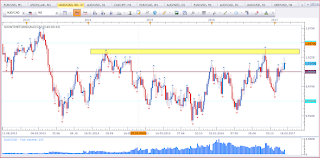
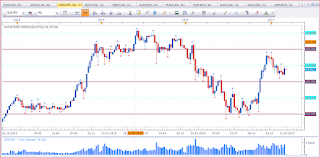
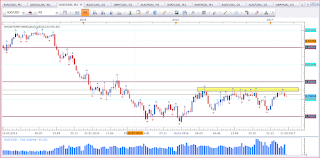
This is AUD vs CAD weekly timeframe. Price did break a local high above parity. This puts my bias in favour of the bulls for the week ahead. There is still some nice distance to resistance marked in yellow. That would be an area to keep an eye on for a possible reversal.
Note:
Last night I needed to take a break so I am contuing this morning the setups for the week.
CAD vs JPY
Bullish bias for the week.
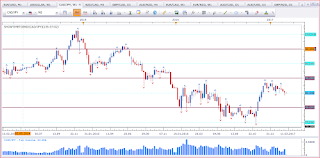
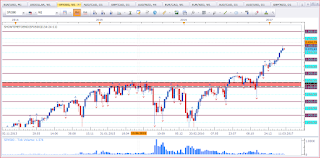
This is CAD vs JPY weekly timeframe. Price is forming a descending channel which could be a bearish sign. However, at this stage it could be a flag and that would be a bullish signal. I am not trading trendlines nor looking for such formations. What I currently see is a rejection of the 85 level which is support. This puts my bias in favour of the bulls. If my analyisis holds true we may be keeping an eye for the break of the flag for further bullish strength and we are in at a low price. If we get a good setup to go long that is.
AUD vs NZD
Mixed signal.
This is AUD vs NZD weekly timeframe. Basically we do have a break above resistance with a close on the top of the candle. This is a bullish signal. However, I prefer breakouts with significant closes above resistance or below support. This puts me on observers mode as the breakout may merely be a bull trap.
EUR vs NZD
Mixed signal.
This is EUR vs NZD weekly timeframe. Basically we have a bullish signal with the strong Bullish Engufling Pattern. Support did hold true (mentioned in here). But price is approaching a resistance level that I first talked about in this post. With price being close to resistance I am not much interested in going long until resistance has been cleared.
EUR vs JPY
Bullish bias for the week.
This is EUR vs JPY weekly timeframe. Price did form a Bullish Engulfing Pattern engulfing the two previous candles. This is a healthy bullish signal. However, price is testing the previous low of the congestion zone (see the first fractal to the left). This is the only thing that is bugging me. The bias remains bullish for the week though.
USD vs JPY
Bullish bias for the week.
This is USD vs JPY weekly timeframe. We have the same pattern as talked about in EUR vs JPY. However, the Bullish Engulfing Pattern on USD vs JPY is not as strong. The downside here is, that price as not able to break the high of the long upper wick two candles to the left and price is below 115. A close above 115 would have been a stronger bullish signal. We do not always get what we want. We need to work with what we get. And that is a Bullish Engulfing Pattern with a rather bitter taste. I prefer EUR vs JPY to this pair.
SPX500 / S&P500
Mixed signal.
This is SPX500 / S&P500 weekly timeframe. Price is in high grounds while DAX is showing resistance in breaking high grounds. I am not yet bearish, however I am suspicious of the move up, Price seems to be weary of progressing higher and may be due for a pullback.
AUD vs USD
Bearish bias for the week.
This is AUD vs USD weekly timeframe. Price did bounce off resistance and currently approaching support. The resistance level has proved itself. Below resistance I am bearish.
EUR vs AUD
Bullish bias for the week.
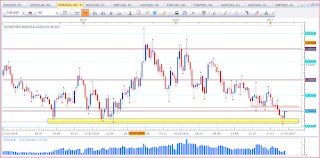
This is EUR vs AUD weekly timeframe. Price did bounce off support with a Hammer (see also here). Last week closed as a stong bullish candle also known as a Bullish Belt Hold. This is a bullish sign. All these put my bias in favour of the bulls for the week. I would have preferred a close above 1,40 but the signal is valid never the less. The trend is bearish and we may see a test of resistance marked in red.
EUR vs GBP
This is EUR vs GBP weekly timeframe. Prive did print a Bullish Engulfing Pattern. Further, we have a higher low. These are signs for strength. Hence my bias is bullish.
GBP vs AUD
Bullish bias for the week.
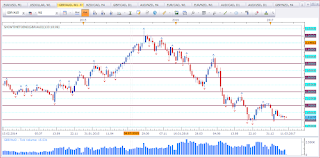
This is GBP vs AUD weekly timeframe. I did label this asset as 'Mixed signal' however I am rather bullish. So fianlly I did decide to go for the bullish bias. Price is at an interesting level and we have a small rejection candle confirming support at 1,60. The rejection candle is not an ideal Hammer as I would prefer a bigger wick and lower prices. However, we do have a rejection candle at an interesting location.
NGAS
Bullish bias for the week.
This is NGAS weekly timeframe. We have two successive Pinbars confirming support. This puts my bias in favour of the bulls. However with the current gap up, I am less likely to take trades long as price is a fair distance away from support. My bias is bullish, but I may not get a good setup to take.
GBP vs NZD
Bearish bias for the week.
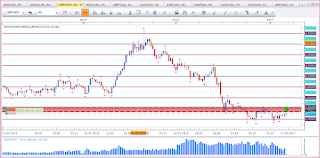
This is GBP vs NZD weekly timeframe. Price is in a range and found resistance at 1,75. As long resistance has not been violated I treat resistance as such.
Thank you for visiting my page. Hope you find the weekly analysis helpful. If you have questions please post them in the comments section below.
Happy trading,
TT



Keine Kommentare:
Kommentar veröffentlichen