Mixed signal.
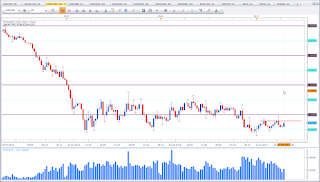
This is EUR vs USD weekly timeframe. Price is inside a range, that is inside a bigger range. Since 1,05 has acted as support since Feb 2015. Currently this asset formed a second high at the same level indicated with the red line. Below this resitance level I am bearish. It will be interesting to see if this level will be tested and honored or if we see a break of that level. For now I do not really have a setup.
EUR vs CAD
Mixed signal.
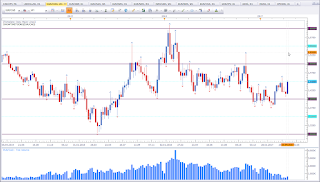
This is EUR vs CAD weekly timeframe. The Bullish Englfing Pattern above 1,40 basically puts my bias in favour of the bulls. However, price was not able to close above 1,45 nor was price able to violate top of the Bearish Engulfing Pattern right at the left. This diminishes the bullish outlook based on the Bull Engulfing Pattern. I would tend to look for bearish setups at resisance (current levels).
AUD vs CAD
Bullish bias for the week.
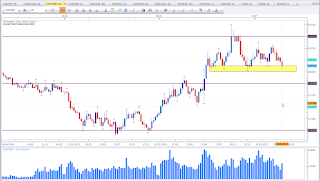
This is AUD vs CAD weekly timeframe. Price formed a three candle reversal pattern names Morning Star at the 1,00 level. This is a bullish sign and puts my bias in favor of the bulls. Price has formed successive higher lows which is also bullish. The final confirmation of the bulls would be a violation of resistance marked in yellow. Currently price is some distance away to worry about resistance. I personally do not like to trade this far above support, but the setup is a valid bullish signal. This means I am more interested in long setups and tend to avoid shorts.
GBP vs USD
Mixed signal.
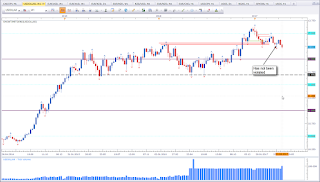
This is GBP vs USD weekly timeframe. Price did break above the range resistance level. This is basically a bullish signal. However, at the moment we cannot tell if it is a valid break or a bull trap. I would have favoured a stronger break of that level. And price is just below the next resistance level marked in red. We may see a pullback to the former resistance level. Then either old resistance/now support will hold and we'll see a continuation or price moves back to ATL for another test.
EUR vs JPY
Bullish bias for the week.
This is EUR vs JPY weekly timeframe. Price formed a Piercing Pattern at/above 115. This puts my bias in favour of the bulls.
GBP vs JPY
Bullish bias for the week.
This is GBP vs JPY weekly timeframe. Price formed a Bullish Engulfing Pattern at a previous support level and above 135. This puts my bias in favour of the bulls. A close above 140 would have been favoured though.
EUR vs GBP
Mixed signal.
This is EUR vs GBP weekly timeframe. Price is sitting on top of support. This is basically bullish. However, there is not a setup to define a bias yet. As long support has not been violated the bias will be bullish. But we need a setup. The wick inside the zone indicates support. But next week may dive deeper into support to close back above. Or we see a violation next week. Time and price will tell.
US Oil
Bearish bias for the week.
This is US Oil weekly timeframe. Price formed a Bearish Engulfing Pattern below the 55 level. This setup puts my bias in favour of the bears. Market structure has formed higher lows but fails to make higher highs. With the Bearish Engulfig Pattern we may have formed a lower high. For now we have support with the next fractal level. If that gets violated we'll most likely see a test of the 45 level.
This week there are three assets with a clear bias. These are EUR vs JPY and GBP vs JPY both bullish for the week,and US Oil bearish for the week. The clear bias is no guarantee for a successful trade. And just because the bias is established does not mean the asset is going to move accordingly. However, the bias helps to reduce the unlimited trading possiblities. If I follow my bias I only have one direction to trade so my I can ignore potential long setups in the case of a bearish bias respectively short setups in the case of a bullish bias.
Before I finish up the weekly analyis I would like to have a look at the USDINDEX
This is FXCM USDINDEX weekly timeframe. As indicated in the chart, price has not violated support and formed an indecision candle. This is not a setup yet, but indicates potential strength. Taking this thought into consideration the mixed signal gets more bearish weight, being at resistance. With GBP vs USD close to resistance may confirm that we will at least see a run back to the breakout level.
Happy trading,
TT


Keine Kommentare:
Kommentar veröffentlichen