Montag, 24. Juli 2017

Setups for the week ahead 24.07.-28.07.17

EUR vs USD

Mixed signal.

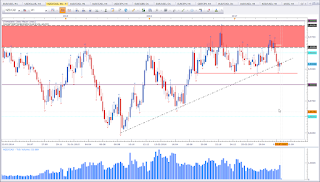
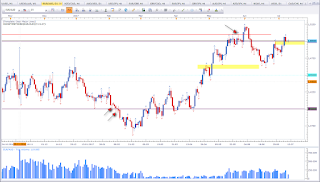
Weekly chart of EUR vs USD

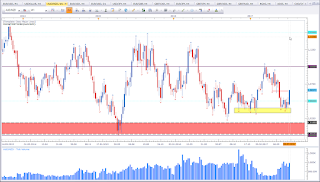
This is the weekly chart of EUR vs USD. It's the first time since 2015 that we have a weekly close above 1,15. This is a bullish sign. However, price is now testing a resistance level. Until last week, I was expecting price to fall back below the 1,15 and head back to the 1,05 level (range support). Price proved me wrong. So I have to re-evaluate. With price closing at resistance, I am rather on the sidelines. We may see a reaction at the yellow rectangle.

AUD vs CAD

Bearish bias for the week.

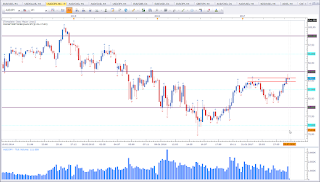
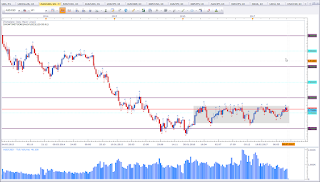
Weekly chart of AUD vs CAD

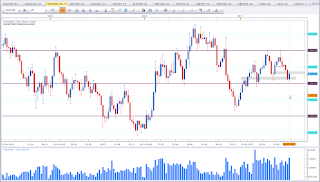
This is the weekly chart of AUD vs CAD. This is an interesting asset.  A difficult one to trade. Techically we  have a break of support followed by a test of support. This puts my bias in favour of the bears. However, we have successive higher lows, which is a bullish sign. We may see a test of the yellow rectangle in the near future. But what I see now is a test of resistance. Hence the bearish bias for the week.

CAD vs JPY

Mixed signal.

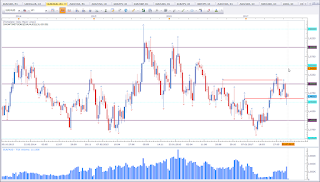
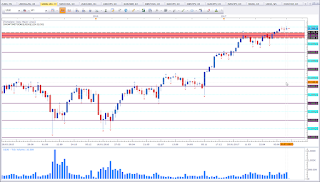
Weekly chart of CAD vs JPY

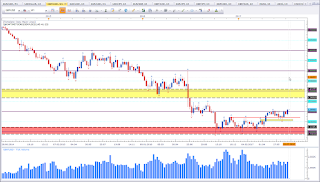
This is the weekly chart of CAD vs JPY. CAD has been strong since the beginning of June. Now price reached a resistance level and it seems CAD vs JPY is not able to violate this level. This puts my bias from bullish to neutral.

AUD vs NZD

Bearish bias for the week.

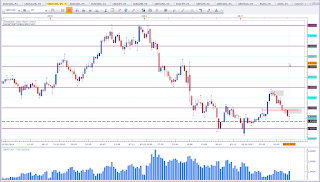
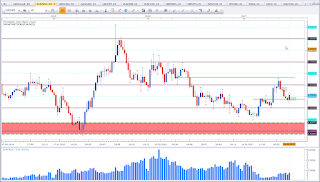
Weekly chart of AUD vs NZD

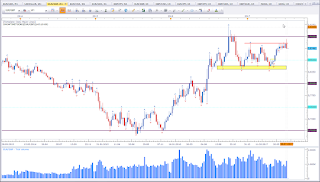
This is the weekly chart of AUD vs NZD. Price bounced off stronlgy off the support level (yellow rectangle) only to test the resistance level it broke in may (red line). We have a Shooting Star at a level of interest. This puts my bias in favour of the bears.

NZD vs CAD

Bullish bias for the week.

Weekly chart of NZD vs CAD

This is the weekly chart of NZD vs CAD. Price is at an interesting level. I am inclined to put my bias as mixed as the setup is not a clear set setup. We can only work with what we currently see on the charts. This is what I see. Price shows sings of support at the level of interest. We don't have a violation of the support level. Two weeks in a row mark about the same low. This puts my bias in favour of the bulls. We may see another run to the ATHs.

GBP vs JPY

Bearish bias for the week.

Weekly chart of GBP vs JPY

This is the weekly chart of GBP vs JPY. Price failed to violate the swing high. This is not a healthy sign for the bulls. Additionally last week closed as a Bearish Engulfing Pattern. These two put my bias in favour of the bears.

AUD vs JPY

Bearish bias for the week.

Weekly chart of AUD vs JPY

This is the weekly chart of AUD vs JPY. After recent Aussie strenght price failed to close above the swing high and formed a Shooting Star. This puts my bias in favour of the bears.

EUR vs AUD

Bullish bias for the week.

Weekly chart of EUR vs AUD

This is the weekly chart of EUR vs AUD. Price shows a Rejection Candle at a level of interest. Last week I did talk about the low that needs to get violated first. (see here) This did not happen. This together with the Rejection Candle put my bias in favour of the bulls.

NGAS

Bearish bias for the week.

Weekly chart of NGAS

This is the weekly chart of NGAS. Price did form a Rejection Candle and closed below the 3,0 level. This puts my bias in favour of the bears.

Cross-Currency-Analysis

AUD appears as the weakest currency for the week. So I will be keeping an eye for opportunities to short the Aussie. EUR appears to be strong, but as EUR approaches a resisance level I might opt to look for another asset to match Aussie with. AUD vs JPY appears vervy interesting. We may see JPY regain strength. So AUD vs JPY is an interesting asset to look to short.

Another good match would be the NZD as NZD also seems to be a strong asset. My favourite assets to trade are AUD vs JPY and AUD vs NZD.

I hope you enjoyed reading and studying my charts.
If you have any questions, please leave them in the comments section below.

Happy trading,
TT
Sonntag, 16. Juli 2017

Setups for the week ahead 17.07.-21.07.17

EUR vs USD

Mixed signal.

Weekly chart of EUR vs USD

This is the weekly chart of EUR vs USD. Price is at the top edge of the weekly range. Last week did close bullish, but with a small body. I consider this as an Indecision Candle. The location is very interesting. I did keep track of this asset ever since price came near the red line. Maybe we see a test of levels above 1,15. The closer price gets to the yellow rectangle, the more interested I get in a reversal until price violates resistance. For now my bias is neutral to bearish. The future path of this asset greatly depends on USDOLLAR performance. A weak dollar will lead to a breakout. A strong dollar will cause a reversal and the range is in play.

GBP vs CAD

Bullish bias for the week.

Weekly chart of GBP vs CAD

This is the weekly chart of GBP vs CAD. Last week did form a Hammer. This is a bullish reversal pattern. A Hammer is a bullish reversal pattern also know as a pinbar. If you have read my article about Pinbars (Taking a closer look at Pinbars Part 1) you the location is important. We have the Pinbar at a level of interest. So my bias is bullish for the week.

AUD vs NZD

Bullish bias for the week.

Weekly chart of AUD vs NZD

This is the weekly chart of AUD vs NZD. Last week I did talk about the Indecision Candle and the support level. Support did hold true. I did mention the support level already mid June and two weeks ago (see here). With the strong move up off the support level I'll be looking for bullish setups on pullbacks. As price is now at a resistance level, we may see a pullback to the congestion area around 1,05.

NZD vs CAD

Mixed signal.

Weekly chart of NZD vs CAD

This is the weekly chart of NZD vs CAD. After hitting The ATH price made a strong move south. The long term trend is bullish, the medium term trend is sideways. Price is now at an interesting level. It is worth to keep an eye on this asset. Will we see another run up to the ATHs? Is the range support level going to hold? Time will tell.

Gold / XAU vs USD

Bullish bias for the week.

Weekly chart of XAU vs USD


This is the weekly chart of Gold  XAU vs USD. Price did attempt to break a higher low but failed to do so. Last week closed as a Piercing Pattern. This puts my bias in favour of the bulls. If USDOLLAR fails to perform, we'll see higher Gold prices. Last time price formed a Piercing Pattern, price went almost to the 1.300 level without really pulling back.

GBP vs USD

Mixed signal.

Weekly chart of GBP vs USD


This is the weekly chart of GBP vs USD. This asset is in the process of starting a trend. All the characteristic signs are present. We have highs that get broken followed by a higher low. The last high did not really get violated in a way I like to see  highs get broken (that is with a strong bullish candle ideally support with high tick volume). GBP has been strong since mid march. If USDOLLAR fails to gain strength, chances are good to see an established bullish trend here. But currently I am just in observing mode. There is another resistance level that needs to be monitored slightly below 1,35.

USDOLLAR

Mixed signal.

Weekly chart of USDOLLAR

This is the weekly chart of USDOLLAR. Price is following suit with its immediate bearish trend and approaching an interesting level. The immediate bias is bearish.

GER30

Bullish bias for the week.

Weekly chart of GER30

This is the weekly chart of GER30 (DAX 30 CFD). Price broke the ATHs and formed a Morning Star Pattern on top of the former ATHs. This puts my bias in favour of the bulls. However, keep in mind, we have summer months. Statistically summer months are the weakest months for equities such as DAX, S&P 500, and Dow Jones.

AUD vs USD

Mixed signal.

Weekly chart of AUD vs USD

This is the weekly chart of AUD vs USD. Price did close for the first time above the grey rectangle. This is a big sign. Basically this close is a bullish sign. But price did fail to close above the red resistance level. So I am stuck between bulls and bears. Next week close will either confirm the bulls or the bears. For now what I see is a close above an interesting level. But I stay alert.

EUR vs AUD

Mixed signal.

Weekly chart of EUR vs AUD

This is the weekly chart of EUR vs AUD. Basically we have a bearish technical signal. Last week did close as a Bearish Engulfing Pattern, which is a bearish signal. But price did close in the vicinity of support which makes me weary of the bearish signal. So my bias is neutral until I see support get violated.

EUR vs GBP

Bearish bias for the week.

Weekly chart of EUR vs GBP

This is the weekly chart of EUR vs GBP. Price was able to wick above resistance only to form a Bearish Engulfing Pattern, which is at the same time a Bearish Outside Candle. I personally do not like to make a distinction of these two. My bias is bearish for the week.

NZD vs USD

Mixed signal.

Weekly chart of NZD vs USD

This is the weekly chart of NZD vs USD. There is no setup yet, but price is at an interesting level. We need to keep an eye on the USDOLLAR also. If we see continued USD weakness, chances are in favour of a breakout. I will keep my eyes on this asset.

Happy trading,
TT

Montag, 10. Juli 2017

Taking a closer look at Pinbars Part 1

Pinbars are about the most popular word known to maybe every trader in the world. While the Pinbar refers to the Bar Chart, they have the same meaning for Candlesticks.

Pinbars are a very powerful setup, yet so strongly missunderstood. Pinbars are very good signals, yet not all Pinbars are worth to be traded. You can trade all Pinbars, but not all Pinbars are profitable. One of the reasons why Pinbars (Hammers and/or Shooting Star Candles) are strongly misunderstood is they are easy to spot. A Pinbar does not look like the average candle. The shape of the Pinbar gives it a special meaning. It’s just like the colour red. Among all other colours, red is the one colour that catches attention immediately. But it is still a colour.

Now, since we are able to spot Pinbars so easily, our minds give Pinbars a stronger meaning. But Pinbars are just random candles, just like any other candles and candle formations. You can trade every pinbar successfully, but not all Pinbars are going to be profitable.
Let me highlight this with the charts below.

Daily chart of GBP vs JPY highlighting Pinbars

and

Weekly chart of EUR vs AUD highlighting Pinbars

As you can see, not all Pinbars are profitable to trade. Yes, I have cherry picked the Pinbars. There are more that I could have picked that only went a small distance in the anticipated direction and resumed back the original path. 

Now don’t get me wrong. I like Pinbars a lot. Pinbars are about one of my most favourite signals. But I don’t trade every Pinbar. The most important point in trading is not the candlestick, but the location of the candlestick signal. If the location is not right, the Pinbar has no meaning. No meaning at all. It may still yield some profit. But that would not be attributed to the power of the Pinbar, but merely to the power of luck.

Now let me discuss why the Pinbar is such a powerful candlestick formation. It is seen easily on the chart. We want that. We do not want to be the only person who sees the setup. And this is valid for all candlestick patterns. We want the whole world to see the candlestick setup. The logic is simple, right?
And the Pinbar is such a candlestick pattern that is very easily seen on the chart. Together with the right location and you can trade Pinbars only and you’ll be a profitable trader.

There is a lot more to talk about Pinbars. I will talk more about Pinbars in future articles.
If you have any questions, please leave them in the comments section below.

Happy trading,

TT
Setups for the week ahead 10.07.-14.07.17

EUR vs USD

Mixed signal.

Weekly chart of EUR vs USD

This is the weekly chart of EUR vs USD. We have a trend within a big range. Price formed successive higher highs and higher lows. Previously price broke above a resistance level and last week closed as a Rejection Candle. Last week close can mean two things. Either last week candlestick formation is a warning of a reversal (Hanging Man), which is a bearish reversal pattern, or last week candle can be regarded as a Rejection Candle which would be in in this instance a bullish continuation signal. I rather go with the trend and regard last week candle as a continuation signal. We may see price break the 1,15 level for the third time. This may be the week we test levels above 1,15. Ultimately I am bearish below the range resistance level. The closer price gets to the top of the range, the more interested I get for bearish setups. There is still more than 250 Pips distance to the top of the range which may be taken advantage off. 

AUD vs NZD

Mixed signal.

Weekly chart of AUD vs NZD

This is the weekly chart of AUD vs NZD. Last week formed an Indecision Candle with long wicks on both sides. Price is indecisive. The only thing that can guide us is the support level this asset is sitting at. Above support I am bullish. 

USD vs JPY

Mixed signal.

Weekly chart of USD vs JPY

This is the weekly chart of USD vs JPY. This asset is interesting (along with the other JPY pairs). Among all JPY pairs, I mostly favour this one. Most of the JPY pairs already made a strong move up, and it seems USD vs JPY is going to catch up with the others. Price is now at a resistance below 115. If this week closes above resistance ideally above 115, we have a healthy sign for more bullishness. That would be the signal for the bullish trend to continue. The other JPY pairs already broke their previous highs. Below are some of the other JPY pairs.

CAD vs JPY


Weekly chart of CAD vs JPY

This is the weekly chart of CAD vs JPY. Price broke the previous high some time ago. This was the strongest mover among the JPY pairs.

EUR vs JPY


Weekly chart of EUR vs JPY

This is the weekly chart of EUR vs JPY. Price broke the previous high two weeks ago and is approaching the next resistance level. 

GBP vs JPY

Weekly chart of GBP vs JPY

This is the weekly chart of GBP vs JPY. Price is approaching a resistance level. A break above would make way for a strong bullish move. 

AUD vs JPY

Weekly chart of AUD vs JPY

This is the weekly chart of AUD vs JPY. Price did break the previous high some time ago and is now approaching the next resistance level. We have a higher high followed by a higher low. Now we price needs to break the high to confirm the bullish trend.

AUD vs USD

Bearish bias for the week.

Weekly chart of AUD vs USD

This is the weekly chart of AUD vs USD. Price is inside a range and currently testing range resistance. Price likes to spike before it follows market structure. We may see a final strike to resistance followed by a move back to range support. Last week did form a Dark Cloud Cover, which is a bearish reversal pattern. This puts my bias in favour of the bears. A conservative approach would be to wait for a close below the two red horizontal lines. But this confirmation would come with an increased stop. I will be keeping a close eye on this asset. Ideally price spikes up and gives a nice setup closer at the top of the range. As there is no such thing as a certain trade, we may get a breakout. A close above the range top would negate the bearish setup and we have to reevaluate.

EUR vs GBP

Mixed signal.

Weekly chart of EUR vs GBP

This is the weekly chart of EUR vs GBP. I have been monitoring patiently this asset since a couple of weeks. Price is still in the vicinity of resistance. Compared to the last 5 weeks we have a change in the closing price. Last week did close signficicantly higher compared to the last 5 weeks. But price failed to violate previous highs. As long price has failed to break the highs, I am rather bearish. So I label this asset as "mixed signal" and wait for the weekly close to establish a weekly bias.

NZD vs USD

Bearish bias for the week.

Weekly chart of NZD vs USD

This is the weekly chart of NZD vs USD. Price formed a Bearish Engulfing Pattern at range resistance. This pattern puts my bias in favour of the bears. But this is not an ideal Bearish Engulfing Pattern. Ideally we have a small bullish candle and a bigger engulfing bearish candle. We may see another test of the yellow zone. As long price stays (closes) below the yellow zone my bias is bearish. Being so close to resistance, I am highly interested in this currency pair.

US30

Bearish bias for the week.

Weekly chart of US30

This is the weekly chart of US30. Price shows struggle breaking the previous highs. The current situation looks toppish. The last 4 weeks have about the same closing price and last week formed a Rejection Candle. Call it a Shooting Star if you like. Ideally the upper wick should have been longer, but the location and the shape qualifies for a Shooting Star. This and the fact that the closing prices are at about the same level puts my bias in favour of the bears.

USDOLLAR

Mixed signal.

Weekly chart of USDOLLAR

This is the weekly chart of USDOLLAR. Last week formed a Piercing Pattern off a monthly level. Price has failed to break above the Trendline (dashed greay line). The Piercing Pattern is an early bullish sign. However, the immediate market structure is bearish. The immediate structure is a series of lower lows and lower highs. If the weekly closes above the Piercing Pattern and ideally above the lower high, than we have a shift of the immediate trend. The overall trend is still bullish. The level is sound for resumption of the overall market structure. We need to see the shift in the immediate trend first to confirm a resumption of the overall market structure. 

Cross Currency Analysis

Having talked about the USDOLLAR I want to continue with Dollar. The current level USDOLLAR is sitting at is very interesting. Other assets confirm the potential of a shift in the immeditate trend. Looking at EUR vs USD, AUD vs USD, and NZD vs USD all of these mentioned assets are at range resistance, waiting for the USD to perform. If USD fails to deliver (gain strength) odds increase for a break of the range resistance. I will keep a keen eye on these mentioned assets. My bias is for range to hold. As long resistance is intact, trade resistance. This is also the reason why I am so interested in USD vs JPY. 

Looking at AUD vs NZD we do not really see a setup yet. But price is sitting at support, which is rather a bullish sign. That would make NZD a favourable quote curreny to trade with USD. This may change though since there is not really a setup. 

If you have any questions, please post them in the comments section below.

Happy trading,
TT
Dienstag, 4. Juli 2017

The Aftermath - The Emotional Killer

Today I want to share my thoughts about how our mind likes to fool us. It does not happen on purpose, but it does happen. And it is very natural to happen.

The aftermath is a natural (let me call it) phenomenon. We see something happened on the chart and feel we missed the obvious trading decision. Either we see the obvious entry we didn't take, or we see the obvious exit we didn't take. Or we are in a trade and did close the trade only to see after some time that the exit was pre mature and we should have stayed in the trade. Sometimes news scare us out, sometimes it is our emotions that get the best of us. Now that we closed the trade we took a small profit but the profit could have been much better if we had stayed.

This kind of aftermath is never going to serve you well. Why(?) you may wonder, since this shows us possibilties how we can improve. But the main point that is missing in the chain of thought is, we are trading on the right edge of the chart. Not on the left side, where we can see what has happened.

We all are great traders on the left side of the chart. After the facts things are so obvious that it seems like the chart was/is screaming at us. And this kind of aftermath is not going to do us good. We will keep doubting our decisions. We will not close a trade when it is time to close, because we feel the trade is going to go in our direction, because last time it did exactly this.

Now let me be clear. We do need the past. We look to the left to evaluate the current situation to generate potential future profit. But if we fall to the trap and start trading hindsight, we are doomed to fail. We are doomed to repeat the same pattern of doubting our decisions.

Hindsight is important, to understand market structure and the characteristic of the asset you are analysing. We do our backtests using past performance of the asset. As long we know this is hindsight trading and we only do this to understand the very characteristic behaviour of the asset, it is healthy. But once we let our mind fool us, we are surely going to go through a lot of emotional pain. This emotional pain in turn is going to make us take bad trading decisions (either by taking trades pre maturely or by hesitating when we have the right time to take the trade). This is a sure way for a vicious circle of pain and drawdown.

There will never be a certain trade. We as traders have to understand that we are acting in uncertainty. Once we understand this, we understand that we work with probabilities. And now the aftermath is not going to hurt us. If we decide to close a trade, because price it is at a level where there is a high probability of a reaction, then closing the trade may be the right decision (depending on your money- and risk management methodology). If the asset continues in the original direction lets sasy 100 pips, then this should not cause us to think, "I should not have closed the trade" or "Now I am missing 100 Pips." The trade got closed because of the probability of a reaction at that level. It could have reversed and left us with no profit at all or worse with a loss.

Doing this kind of aftermath, we will never be right. It is a battle we will never be able to win. Because everything we do will be wrong. Why take the battle then in the first place. Imagine if we had not closed the trade and price did retrace. Then we'd think "I should have closed the trade and taken the profit". You see, this kind of aftermath is not going to serve us well.

Thank you for reading. If you have any questions please leave them in the comments section below.

Happy trading,
TT

Sonntag, 2. Juli 2017

Setups for the week 03.07.-07.07.17

EUR vs USD

Mixed signal.

Weekly chart of EUR vs USD

This is the weekly chart of EUR vs USD. Price is aproaching the range resistance level. This catches my attention. We may see a signal with next week close. Since 2015 price was only twice able to move above 1,15. We may now see the third attempt.

GBP vs CAD

Mixed signal.

Weekly chart of  GBP vs CAD

This is the weekly chart of GBP vs CAD. Price is at an interesting level. Last week closed as an Indecisin Candle inside an Indecision Candle. This shows there is support at current levels. The weekly close might confirm the support and give us a bullish setup next week.

AUD vs NZD

Bullish bias for the week.

Weekly chart of AUD vs NZD

This is the weekly chart of AUD vs NZD. I was talking about this level already in mid June (here). Support held true. Last week closed as a Piercing Pattern, which is a bullish reversal pattern. This puts my bias in favour of the bulls, even though I'd have favoured a close above 1,05. But we have a bullish setup at support. So I will ignore short opportunities and keep an eye for long opportunities.

EUR vs NZD

Bullish bias for the week.

Weekly chart of EUR vs NZD

This is the weekly chart of EUR vs NZD. We have a Bullish Engulfing Pattern at support. While this is not an ideal Bullish Engulfing Pattern, the engulfing candle is also an Outside Bar/Candle. A solid bullish candle has the close near the high which would be a preferable setup. But the setup is valid as it is at a significant level. I did highlight this level already two weeks ago (here). This level proved to be significant and we finally did get our signal.

GBP vs USD

Bullish bias for the week.

Weekly chart of GBP vs USD

This is the weekly chart of GBP vs USD. I saw the possible long setup last week, but I was not too keen on looking to go long GBP vs USD cause USDOLLAR was also suggesting bullisness (see here). But USD failed to prove it's strength and we had a strong run on GBP vs USD and EUR vs USD. If USD fails to gain strength, we will see a continued strong GBP vs USD run and possigly a break of the big range on EUR vs USD. I do have mixed feelings about this asset. Technically we have a bullish trend (higher highs and higher lows). We have a bounce off a previous high. Technically we should see a continuation of this pattern. But the current level is a significant level which needs to get violated. The bias for the week is bullish. But this does not mean I have to take a trade. In doubt, stay out. I will have to evaluate as time the week progresses.

USDOLLAR

Bearish bias for the week.

Weekly chart of USDOLLAR


This is the weekly chart of FXCM USDOLLAR. Last week close did negate the supposed bullish bias I did have up to last week. The close below the prevous two pinbars is a sign of weakness. As long USDOLLAR does not hit support I will have a bullish bias on GBP vs USD and EUR vs USD. The first level I have an eye on is 12. The next support levels are quite some distance away so we may have a nice run on the other assets.

EUR vs JPY

Bullish bias for the week.

Weekly chart of EUR vs JPY

This is the weekly chart of EUR vs JPY. Price is making higher highs and higher lows. Last week did break a high with a strong bullish candle. Breaking previous highs, we want to see strong bullish candles. This puts my bias in favour of the bulls which is in line with the current bullish trend.

USD vs JPY

Bullish bais for the week.

Weekly chart of USD vs JPY

This is the weekly chart of USD vs JPY. Price found support at the 110 level and is steady making bullish candles. I am looking for a test of 115 sometime in the future.

GBP vs JPY

Bullish bias for the week.

Weekly chart of GBP vs JPY

This is the weekly chart of GBP vs JPY. Price made a bounce off 140 and closed above 145. Currently price is approaching  aresistance level. If the current strength stays, we should see a break of the high and a nice bullish move. The close above 145 puts my bias in favour of the bulls.

AUD vs USD

Mixed signal.

Weekly chart of AUD vs USD

This is the weekly chart of AUD vs USD. Price is approaching range resistance. This diminishes the supposed bullish move. There is a trend inside the range. But as long range levels have not been violated, range tactics come to play. Keeping the weak outlook for USDOLLAR on the back of my mind, we may see a break out. But currently range resistance is the first level of interest.

EUR vs GBP

Bearish bias for the week.

Weekly chart of EUR vs GBP

This is the weekly chart of EUR vs GBP. My bias remains bearish. Four weeks in a row, price was not able to violate the red line. And the weekly closing price has not moved much. This puts my bias in favour of the bears.

GBP vs AUD

Bullish bias for the week.

Weekly chart of GBP vs AUD

This is the weekly chart of GBP vs AUD. Price made a bounce off a support level but failed to close above 1,70. Last week did form a Morning Star Pattern which is a bullish reversal pattern. Even though price failed to close above 1,70 my bias is in favour of the bulls.

US Oil

Bullish bias for the week.

Weekly chart of US Oil

This is the weekly chart of US Oil. Price performed a bounce off the support level. We have a Bullish Engulfing Pattern at Support. This puts my bias in favour of the bulls.

GBP vs NZD

Bullish bias for the week.

Weekly chart of GBP vs NZD

This is the weekly chart of GBP vs NZD. Price did retrace to the 1,75 level and formed a Bullish Engulfing Pattern at a level of previous congestion. This puts my bias in favour of the bulls.

Happy trading,
TT