EUR vs USD
Mixed signal.
This is the weekly chart of EUR vs USD. Price is at the top edge of the weekly range. Last week did close bullish, but with a small body. I consider this as an Indecision Candle. The location is very interesting. I did keep track of this asset ever since price came near the red line. Maybe we see a test of levels above 1,15. The closer price gets to the yellow rectangle, the more interested I get in a reversal until price violates resistance. For now my bias is neutral to bearish. The future path of this asset greatly depends on USDOLLAR performance. A weak dollar will lead to a breakout. A strong dollar will cause a reversal and the range is in play.
GBP vs CAD
Bullish bias for the week.
This is the weekly chart of GBP vs CAD. Last week did form a Hammer. This is a bullish reversal pattern. A Hammer is a bullish reversal pattern also know as a pinbar. If you have read my article about Pinbars (Taking a closer look at Pinbars Part 1) you the location is important. We have the Pinbar at a level of interest. So my bias is bullish for the week.
AUD vs NZD
Bullish bias for the week.
This is the weekly chart of AUD vs NZD. Last week I did talk about the Indecision Candle and the support level. Support did hold true. I did mention the support level already mid June and two weeks ago (see here). With the strong move up off the support level I'll be looking for bullish setups on pullbacks. As price is now at a resistance level, we may see a pullback to the congestion area around 1,05.
NZD vs CAD
Mixed signal.
This is the weekly chart of NZD vs CAD. After hitting The ATH price made a strong move south. The long term trend is bullish, the medium term trend is sideways. Price is now at an interesting level. It is worth to keep an eye on this asset. Will we see another run up to the ATHs? Is the range support level going to hold? Time will tell.
Gold / XAU vs USD
Bullish bias for the week.
This is the weekly chart of Gold XAU vs USD. Price did attempt to break a higher low but failed to do so. Last week closed as a Piercing Pattern. This puts my bias in favour of the bulls. If USDOLLAR fails to perform, we'll see higher Gold prices. Last time price formed a Piercing Pattern, price went almost to the 1.300 level without really pulling back.
GBP vs USD
Mixed signal.
This is the weekly chart of GBP vs USD. This asset is in the process of starting a trend. All the characteristic signs are present. We have highs that get broken followed by a higher low. The last high did not really get violated in a way I like to see highs get broken (that is with a strong bullish candle ideally support with high tick volume). GBP has been strong since mid march. If USDOLLAR fails to gain strength, chances are good to see an established bullish trend here. But currently I am just in observing mode. There is another resistance level that needs to be monitored slightly below 1,35.
USDOLLAR
Mixed signal.
This is the weekly chart of USDOLLAR. Price is following suit with its immediate bearish trend and approaching an interesting level. The immediate bias is bearish.
GER30
Bullish bias for the week.
This is the weekly chart of GER30 (DAX 30 CFD). Price broke the ATHs and formed a Morning Star Pattern on top of the former ATHs. This puts my bias in favour of the bulls. However, keep in mind, we have summer months. Statistically summer months are the weakest months for equities such as DAX, S&P 500, and Dow Jones.
AUD vs USD
Mixed signal.
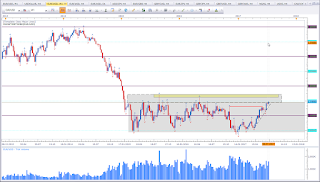
This is the weekly chart of AUD vs USD. Price did close for the first time above the grey rectangle. This is a big sign. Basically this close is a bullish sign. But price did fail to close above the red resistance level. So I am stuck between bulls and bears. Next week close will either confirm the bulls or the bears. For now what I see is a close above an interesting level. But I stay alert.
EUR vs AUD
Mixed signal.
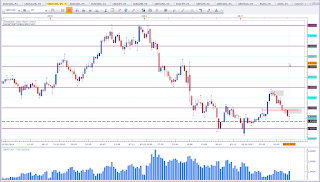
This is the weekly chart of EUR vs AUD. Basically we have a bearish technical signal. Last week did close as a Bearish Engulfing Pattern, which is a bearish signal. But price did close in the vicinity of support which makes me weary of the bearish signal. So my bias is neutral until I see support get violated.
EUR vs GBP
Bearish bias for the week.
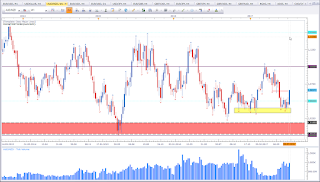
This is the weekly chart of EUR vs GBP. Price was able to wick above resistance only to form a Bearish Engulfing Pattern, which is at the same time a Bearish Outside Candle. I personally do not like to make a distinction of these two. My bias is bearish for the week.
NZD vs USD
Mixed signal.
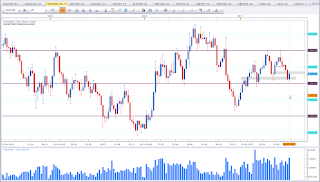
This is the weekly chart of NZD vs USD. There is no setup yet, but price is at an interesting level. We need to keep an eye on the USDOLLAR also. If we see continued USD weakness, chances are in favour of a breakout. I will keep my eyes on this asset.
Happy trading,
TT




Keine Kommentare:
Kommentar veröffentlichen