Mixed signal.
 |
| EUR vs USD W1 |
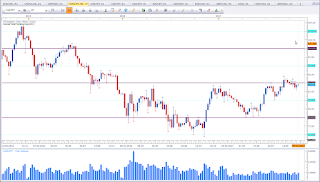
This is the weekly chart of EUR vs USD. Price is testing the red support level. But we have the beginning signs of a trend shift. I am not interested in bullish setups. Last week failed to violate the previous high. What I said last week about this asset remains valid. See here for last week analysis on this pair.
CAD vs JPY
Mixed signal.
 |
| CAD vs JPY W1 |
AUD vs NZD
Mixed singal.
 |
| AUD vs NZD W1 |
This is the weekly chart of AUD vs NZD. Price is at a level of interest. It is worth to keep an eye on this asset. Price has made successive higher highs and may now form the next higher low.
EUR vs NZD
Bullish bias for the week.
 |
| EUR vs NZD W1 |
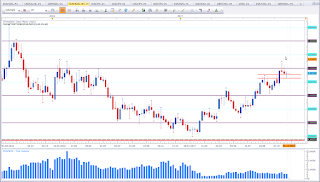
This is the weekly chart of EUR vs NZD. Price formed a Hammer at a level of support. Some traders may call this a Hanging Man since price has moved up already. But we are making higher highs and higher lows. And recently we had a violation of a previous high that got tested now (see the two red horizontal lines). We have an established bullish trend and price is giving a bullish signal at a level of interest. This puts my bias in favour of the bulls.
If you have any questions or feedback, please leave them in the comments section below.
Happy trading,
TT
Keine Kommentare:
Kommentar veröffentlichen