Bearish bias for the week.
 |
| EUR vs CAD W1 |
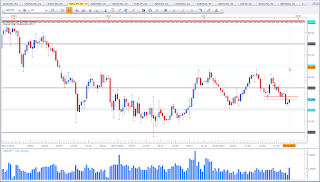
This is the weekly chart of EUR vs CAD. Last week did close as a Shooting Star. The week did close with good CAD news. Price failed to break the swing high. This puts my bias for the week ahead in favour of the bears. Price is testing the resistance level. I am not inclined to look for short opportunities above 1,50. As long price is above 1,50 I am willing to give the market the chance to break resistance.
NZD vs JPY
Mixed signal.
 |
| NZD vs JPY W1 |
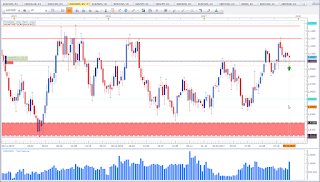
This is the weekly chart of NZD vs JPY. Price shows all signs of a trend shift with a lower high and a lower low. There is a good chance we may see a test of the 75 level. That is the next critical level. But there is no bearish weekly setup, hence the label "mixed signal." It is weel worth to keep an eye on this asset. I'll get more interested once price gets closer to the critical level.
AUD vs NZD
Bullish bias for the week.
 |
| AUD vs NZD W1 |
US Oil
Mixed signal.
 |
| US Oil W1 |
This is the weekly chart of US Oil. There is no setup as of yet. But price is approaching an interestig level. That's why this asset is listed here. Last week did close as a Hanging Man, which is a bearish reversal pattern. However, a Hanging Man needs to get confirmed. I personally do not like trading Hanging Man formations, cause these can also be interpreted as a bullish pattern representing a rejection of lower prices. Count three candles back and you see a nice Hanging Man formation. That's why we need to wait for confirmation of a Hanging Man. For now, all I care is the level. And the level is interesting.
If you have feedbacks or any questions, please leave them in the comments section below.
Happy trading,
TT
Keine Kommentare:
Kommentar veröffentlichen