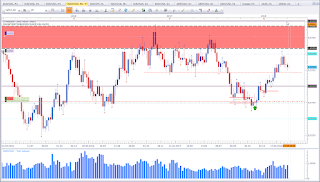
EUR vs CAD
Bearish bias for the week.
 |
| EUR vs CAD W1 |
This is the weekly chart of EUR vs CAD. The significance of the 1,60 level is clearly seen on this chart. Price did close above the 1,60 level and immediately corrected more than 500 Pips. The close below the grey box catches my attention. This is an early sign I that we may see a correction. The close below the box puts my bias in favour of the bears for the week.
NZD vs JPY
Bullish bias for the week.
 |
| NZD vs JPY W1 |
This is the weekly chart of NZD vs JPY. Price did react at support. There is some resistance (red horizontal line to the left). If price clears that level, that will be a healthy sign for the bulls.
USD vs CAD
Bearish bias for the week.
 |
| USD vs CAD W1 |
This is the weekly chart of USD vs CAD. Price shows reaction at the 1,30 level. Previously we had a Dark Cloud Cover signal, which is a bearish reversal pattern. Price did halt for a week. With last week close we had the follow through. The close below the Mother Candle puts my bias in favour of the bears. However, keep in mind that price did make a new high, which basically is a bullish sign. We need to take everything into consideration. The markets talk to us, it is up to the trader to listen. Immediate structure is bulish, with a high followed by a higher low, than having a higher high. We may see a correction to the 1,25 level. We have to evaluate as time and price progress.
NZD vs CAD
Bullish bias for the week.
 |
| NZD vs CAD W1 |
This is the weekly chart of NZD vs CAD. Counter the the rejection of the 0.95 level mentioned in the monthly analysis, the weekly shows a reaction at support (red dashed line). Price did break resitance, came back and gets rejected. This is a bullish sign, hence my bias is bullish for the week. This does not mean I am looking to buy this asset. This analysis helps me to manage my positions. I am aware of the monthly Rejection Candle.
Thank you for reading. If you have any questions or would like to give feedback, please leave them in the comments section below.
Happy tradig,
TT
Keine Kommentare:
Kommentar veröffentlichen