Mixed signal.
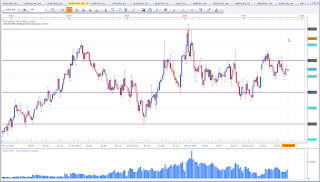
This is the weekly chart of EUR vs USD. The previous week I did mention the early signs of a potential correction. Price failed to violate a potential support level. I still want to see a test of the range resistance level marked with the black horizontal line. But currently price is at a support level. Above this level my bias is neutral until I see signs to to reevaluate.
If USDOLLAR strengths remains, we may see a test of the black horizontal line or even lower prices. We need to keep an eye on the USD Index for more clues.
EUR vs CAD
Bullish bias for the week
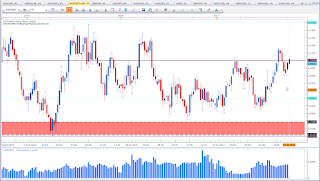
This is the weekly chart of EUR vs CAD. My bias has not changed from last week. Same applies for price though. Above 1,45 my bias remains bullish.
AUD vs NZD
Bullish bias for the week.
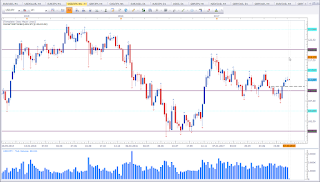
This is the weekly chart of AUD vs NZD. Last week formed a Morning Star Pattern, which is a bullish reversal pattern. I would have favoured a close above 1,10 but we do not always get what we wish. Price did break a previous swing high, retraced and formed a reversal pattern at a level of interest. And this puts my bias in favour of the bulls.
USDOLLAR
Mixed signal.
This is the weekly chart of the FXCM USD Index. I did label this asset as neutral because we may see a reaction. The close above the trendline and above the 12 level is a bullish sign. However, price failed to close above the Shooting Star Candle with the Fractal on top of it. The weekly close will shed more light. I see a chance for price to rise to 12,25. This would be in line with my thoughts about other USD pairs such as the EUR vs USD. Currently we have a bullish sign, but we may see a reaction. So I am not keen on trading EUR vs USD until my target levels get tested. Or I see a weekly setup that proves me wrong.
EUR vs JPY
Mixed signal.
This is the weekly chart of EUR vs JPY. Price is at an interesting level. This asset seems like it wants to test the 110 level. Currently there is no setup, but it is well worth to keep an eye on this asset.
USD vs JPY
Bearish bias for the week.
This is the weekly chart of USD vs JPY. The structure looks week. This asset shows resistance to move higher. We may see a reaction. Last week closed as an Indecition Candle which could be classified as a Shooting Star. While I am not keen on trading this asset, I might look for shoting opportinties this week, beause of the fragile up move. This may be an early sing for a correction.
Copper
Bullish bias for the week.
This is the weekly chart of Copper. Price formed a modified Morning Star Pattern with last week close. This is as already mentioned above a bullish reversal pattern. Ideally last week should have closed above the bearish candle. But the close is high enough to talk about a Morning Star Pattern. Price is making higher highs and higher lows, which is characteristic for a bullish trend. The Morning Star Pattern may form the higher low in this series of higher highs and higher lows.
AUD vs USD
Mixed signal.
This is the weekly chart of AUD vs USD. Price is at an interesting level. It is well worth to keep an eye on this asset. As mentioned above, we need to keep an eye on USDOLLAR also to further enhance our odds. I am looking for a bounce off the range resistance level. We may however see price move deeper into the rectangle. At this moment, it is too early to talk about a setup.
I hope you enjoy my weekly analysis. If you have any questions or suggestions, please leave them in the comments section below.
Happy trading,
TT


Keine Kommentare:
Kommentar veröffentlichen