Today I
want to talk about trends. We all did hear the famous line “The trend is your
friend.” Well, this line is so true. But this simple sentence leads to a lot of
confusion. So let’s delve into this matter.
But let me
confuse you a little bit more. I promise I will clean up the mess. What is a
trend? Some see three bullish candles in a row and call it a trend. Then there
are traders who put a Moving Average on the chart and say if price is above
that line, the trend is bullish and below that line for bearish. Then there are
trades that look at an oscillator and say if price is above the 0-line, the
trend is bullish and below the 0-line for bearish. I am not going to say this
is wrong, as there are many different ways to approach a trade. But I want to
state, that there is a lot of information missing in this approach. Others talk
about higher highs and higher lows, which is about the classic definition of a
trend. While I tend to agree with the latter one, there is still information
missing. Talking about trend requires more than saying “the trend is bullish”
or “the trend is bearish”.
Let’s talk
about fractals. The markets are fractal by nature. And I am not talking about
the Bill Williams Fractal Indicator. Not yet that is. So what are fractals? Did
anyone of you ask yourself this question? Now we are getting into Chaos Theory.
No worries, I am not going to lecture you about the theory of complex systems.
When we think of Chaos we have a picture in mind where there is no order at all.
Most of us do not know that Chaos is a higher form of order (complex and
dynamic). We are already talking about fractals. Fractals are self repeating
patterns. While each single pattern looks the same, each single pattern is
individual. Snowflakes are very a very good example to describe the fractal
nature. Each individual snowflake looks like the other. But in detail they are
all unique. And this applies to the financial markets as well. I can post any
chart and hide the timeframe. No one would be able to tell what timeframe it
is. This is the fractal nature of the markets. And now we are getting closer to
talk about trends.
Above I
gave a classic definition of trends. We are looking for a series of higher
highs and higher lows for a bullish trend. A bearish trend therefore would come
with a series of lower lows and lower highs. But since markets are fractal by
nature, we need to define the timeframe. Let me give you a fictive example
where we are looking at the daily timeframe and we see a series of higher highs
and higher lows; hence we have a bullish trend on the daily timeframe. But this
may merely be a pullback on the weekly timeframe, where we have a series of
lower lows and lower highs. Or a series of same level highs and same level
lows, which would define a ranging market.
Let me
illustrate this with some charts. I will not go into details at this time as
that would take too much time and space. For now we’ll take a general view of
the market flow.
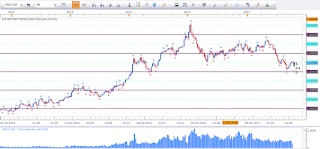
 |
| USD vs CAD H4 |
This is the 4 Hour chart of USD vs CAD showing us a series of higher highs and higher lows. This is bullish.
 |
| USD vs CAD D1 |
This is the
daily chart of USD vs CAD showing us a series of lower lows and lower highs.
This is bearish.
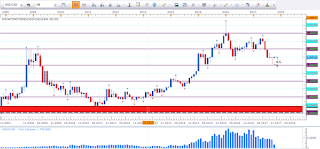
 |
| USD vs CAD W1 |
This is the
weekly chart of USD vs CAD showing us a series of higher highs and higher lows.
Recently we are seeing a potential shift of trend (more about this in a later
post).
 |
| USD vs CAD M1 |
This is the
monthly chart of USD vs CAD showing us a series of higher highs and higher
lows. This is bullish.
As you can
see by the charts, it is not suffice to say the trend is bullish. We need to
refer to the trend on a specific timeframe. The charts clearly show that a
pullback on one timeframe can be a trend on another timeframe. And this goes on
and on. We have a bullish trend on the monthly timeframe while the daily is
bearish. The weekly already formed a lower low and a lower high, which is
basically bearish but the monthly is in a bullish trend.
I
will get deeper in the topic of trends in future posts. I hope you enjoyed this article and found value in reading it. If you have any questions and feedback/suggestions please leave them in the comments section below.
Happy trading,
TT
Keine Kommentare:
Kommentar veröffentlichen