Bullish bias for the month.
 |
| EUR vs USD M1 |
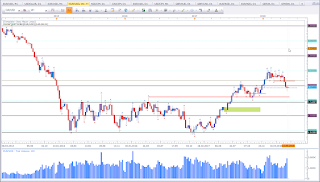
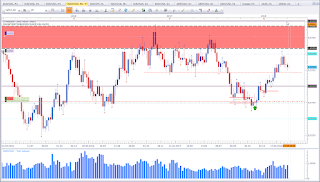
This is the monthly chart of EUR vs USD. Price did reach on of the target levels and formed a Doji. The Doji at the red level is significant. I would favour a further decline though. The level I would have loved to see get tested, had been the green rectangle. But we see signs of reaction at a level of interest that I had highlighted already in April (see here) and May (see here). We may still get another move down, but I do not trade what I think may happen. I trade what I see. And that is a potential reverdal at a level of interest.
GBP vs CHF
Mixed signal.
 |
| GBP vs CHF M1 |
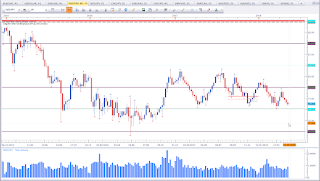
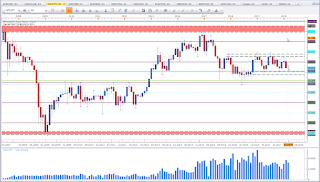
This is the monthly chart of GBP vs CHF. Price formed a bearish reversal pattern. However, price is at a support level. Last month bearish close may be a pullback. This asset is in the process of a trend shift. We have a higher high and successive higher lows, which is bullish. Sooner or later, we'll see a move back to 1,60 area. But we will only know after the facts. For now I am rather staying on the sidelines and observing how price reacts at the current level.
EUR vs CAD
Mixed signal.
 |
| EUR vs CAD M1 |
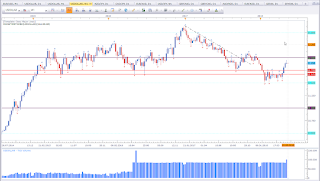
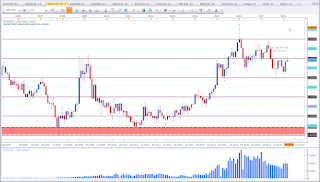
This is the monthly chart of EUR vs CAD. Price did pullback from the 1,60 level to a level of interest and shows reaction at this level. This does not put my bias in favour of the bulls yet, but it catches my interest. The long upper wick shows, there is selling pressure at the 1,55 level. This makes me wonder if there is still supply left at the 1,55 level.
XAG vs USD
Mixed signal.
 |
| XAG vs USD M1 |
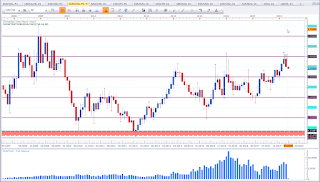
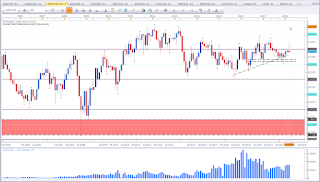
This is the monthly chart of XAG vs USD (Silver). Price is sitting at an interesting level and fails to violate it. The series of lower highs shows bearish pressure. The question that arises is, which one is going to fail. I prefer a move to the upside, because that would be easier to trade. For now I am sitting on the sidelines and observing only. It may pay to keep an eye on this asset.
USD vs CAD
Mixed signal.
 |
| USD vs CAD M1 |
This is the monthly chart of USD vs CAD. Price failed to close above the local high and formed a Rejection Candle. This is a bearish signal. A close below the 1,30 level would have given me a bearish bias. We have higher highs and higher lows which is bullish. This tells me to keep my hands on my laps and wait for a clear signal.
GBP vs AUD
Mixed signal.
 |
| GBP vs AUD M1 |
This is the monthly chart of GBP vs AUD. After the Evening Star, price failed to follow suit and formed an Indecision Candle at a level of interest. The immediate market structure is bullish. Now I need a confirming sign for the bulls or for the bears.
If you have questions or would like to give feedback, please leave them in the comments section below.
Happy trading,
TT
