EUR vs USD
Mixed signal.
 |
| EUR vs USD M1 |
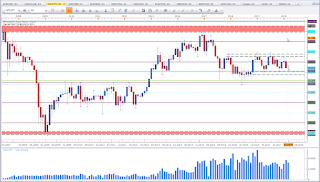
This is the monthly chart of EUR vs USD. The chart above shows a shift of the trend. This asset has been in a range leaning back to March 2015. Price did break the range and mark significant signs of a trend shift. I was expecting a correction back to the green level and kept my hands on my lap (see
this link for my last EUR vs USD analysis). Price is at an intereting level. We do not really have a setup at this level yet. Ideally I'd like to see a correction from this level and a test of the red horizontal level. For now, I will stay neutral on this asset.
Mixed signal.
 |
| EUR vs CAD M1 |
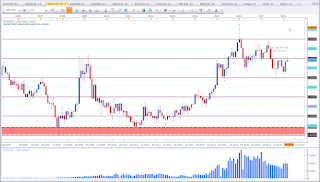
This is the monthly chart of EUR vs CAD. Price is at an intereting level. This asset failed to close above the 1,60 level and price failed to break the swing high. But note that price made successive higher swing lows, which shows bullish preassure. What I see now is, price failed to violate the previous high, which is not healthy for the bulls. Hence I'll refrain from bullish engagements. I did have a long position here, which I closed at about the 1,60 level (see
here). April close will shed more light. Unfortunately I won't have the time to do the weekly analysis. It would be interesting to see how the weekly reacts at this level to get early signs.
CAD vs JPY
Bullish bias for the month.
 |
| CAD vs JPY M1 |
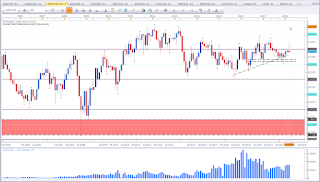
This is the monthly chart of CAD vs JPY. Price did form a bullish Rejection Candle at the 80,00 level. Price failed to violate the previous low and formed a Rejection Candle (a Hammer like candle), which puts my bias in favour of the bulls. I personally would have liked to see a stronger push south with a close at the same level, but we do not always get what we want. We trade what we see. And that is a rejection of the 80 level.
NZD vs JPY
Bullish bias for the month.
 |
| NZD vs JPY M1 |
This is the monthly chart of NZD vs JPY. Price formed a Doji smack dab at Support. This puts my bias in favour of the bulls for the month. I'd have loved to see a test of the 70 level, though. We may still see a test of the 70 level. But what we see at the moment is a setup at support.
GER30 / DAX30
Mixed signal.
 |
| GER30 / DAX30 M1 |
This is the monthly chart of GER30 / DAX30. The trend is bullish and price formed a Rejection Candle at support. Price was not able to violate the previous low. All these are bullish signs. Go with the trend. As you can see, I did take a trade. But due to seasonality we may see a ranging market. Either I am bullish or neutral. I will stay away from bearish positions for the time being. One form a Riskmanagement is to reduce the unlimited possibilities of trading.
EUR vs JPY
Mixed signal.
 |
| EUR vs JPY M1 |
This is the monthly chart of EUR vs JPY. The previous month did form a Bearish Engulfing Pattern which engulfs 3 to 4 previous candles. Last month failed to follow suit which diminishes the bearish outlook on this asset. Price did break a previous high and may form a new high at the 135 level. We'll only know for sure after the facts. I'll keep my eyes on this asset. I'd like to see a test of the 125 level.
USD vs CAD
Bearish bias for the month.
 |
| USD vs CAD M1 |
This is the monthly chart of USD vs CAD. Price failed to close above the previous high and close above 1,30. Further, price formed a Rejection Candle which could be classified a Shooting Star. Ideally I'd like to see a Shooting Star at a swing high. The 1,30 level is a level of interest. And last month candle confirms this level of interest. The rejection of 1,30 puts my bias in favour of the bears.
AUD vs CAD
Mixed signal.
 |
| AUD vs CAD M1 |
This is the monthly chart of AUD vs CAD. Price has been trading inside the range leaning back to July 2013 (marks the bottom). Price is inside the range, which makes trading this asset hazardous. However, price showed rejection at an interesting level, which catches my attention. The rejection of the range resistance and the parity level puts my bias in favour of the bears.
NZD vs CAD
Mixed signal.
 |
| NZD vs CAD M1 |
This is the mothly chart of NZD vs CAD. Price shows rejection of the 0,95 level, which puts me on alert. Price is close to the ATH and forms a Rejection Candle. Now it is time to adjust my stops, think about taking profit, and even consider looking for short opportunities. The market will not reverse immediately, but my bias has switched.
Cross Market Analysis
CAD appears to be one of the stronger currencies for the month ahead. So I'll be preferably looking for opportunities to buy CAD. I haven't talked much about AUD as there has not been many setups with AUD. However, AUD appears weak. I'll attach below GBP vs AUD and EUR vs AUD.


Both AUD pairs are moving north. EUR vs AUD is in close vicinity to resistance. But currently there are no signs of a reversal. So I'll maintain the bullish bias. GBP vs AUD did break a high and continues with bullish strength.
The cross analysis would not be complete if I didn't look at the USD Index.
 |
| USDOLLAR M1 |
This is the monthly chart of FXCM USD Index. Price did break a level of interest but is still in the vicinity of support Support and resistance are never a straight line but rather an area. The immediate bias is bearish, as we have firs signs of a trend shift. The long term bias is still bullish. This asset is not helpful to establish a bias for EUR vs USD.
If you have any questions or would like to give feedback, please them in the comments section below.
Happy trading,
TT


Keine Kommentare:
Kommentar veröffentlichen