EUR vs USD
Mixed signal.
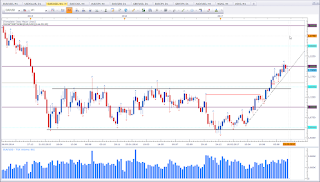
This is the weekly chart of EUR vs USD. Price did break out of the consolodation area and moved nicely to the 1,20 level. Price is now at an interesting level and we may see a correction from here. We do not have the weekly signal to talk about a correction yet, but we have early signs. A weekly close below the black trendline would generate a signal for a correction. This asset is definetly on my watch list.
EUR vs CAD
Bullish bias for the week.
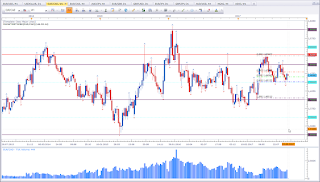
This is the weekly chart of EUR vs CAD. Price formed a Bullish Engulfing Pattern at a support level which has been confirmed before. This puts my bias in favour of the bulls.
EUR vs NZD
Mixed signal.
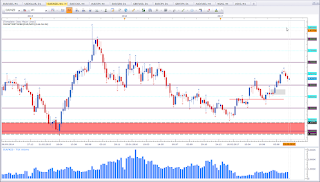
This is the weekly chart of EUR vs NZD. Price is at a support level and formed a weekly Indecision Candle. This alone is not a setup yet, but may be already a first sign for a setup. Keep an eye on this asset.
USDOLLAR
Mixed signal.
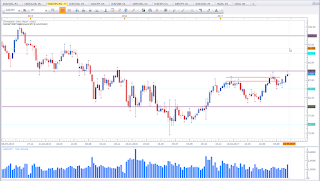
This is the weekly chart of FXCM USDOLLAR. FXCM uses it's very own USD Index which is different to the convetional. However, we can still use this index as reference. Price is now at an interesting level. This is a level we may see a bounce off. A close above the bearish candle would mark a setup. If we see Dollar bulls, we'll see a weak EUR vs USD.
GBP vs JPY
Mixed signal.
This is the weekly chart of GBP vs JPY. I am tempted to label this asset as bearish. Price formed a Shooting Star like Indecision Candle at resistance, after breaking a previous top. Last week may be only a pause in a bullish move, or it may signal exhaustion. If I manage to get short position I'll keep a keen eye on the breakout level to the left. That level is a level that is very likely to get tested. Only next week close will give us a complete picture.
AUD vs JPY
Bearish bias for the week ahead.
This is the weekly chart of AUD vs JPY. Price was barely able to break the previous top. The first attemtpt to break the swing high resulted in a Shooting Star. The second attempt to break the swing high did end up again in a Shooting Star. This tells me that price is having a hard time to move above the 90 level. Prive may need a third attempt to break the new swing high. If this is true we may see another correction.
GBP vs AUD
Mixed signal.
This is the weekly chart of GBP vs AUD. Price formed a Doji at 1,70 level. This level is relevant. Currently we don't know if the Doji is a pause in a bullish move, or if the Doji marks a reversal. A weekly close below the Doji would be a bearish setup. I am tempted to label this asset as bearish, but without a clear setup I'll refrain from doing so.
I hope you enjoy my analysis and find valuable information here.
If you have any questions please leave them in the comments section below.
Happy trading,
TT


