Sonntag, 26. November 2017

Setups for the week ahead 27.11.-01.12.17

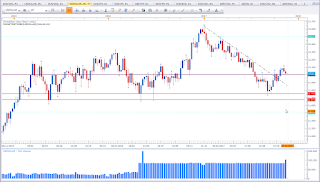
NZD vs JPY

Mixed signal.

Weekly chart of NZD vs JPY
NZD vs JPY W1
This is the weekly chart of NZD vs JPY. Price did break a swing low and is about to test the next swing low. The 75 level is a level of interest. As price approaches this level it catches my interest. That's why this asset is listed here.

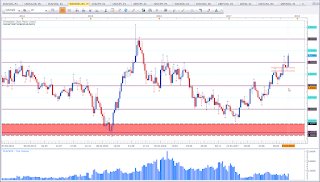
AUD vs NZD

Mixed signal.

Weekly chart of AUD vs NZD
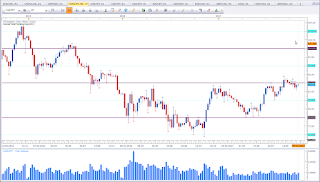
AUD vs NZD W1
This is the weekly chart of AUD vs NZD. Price did form an Outside Bar (and a Bullish Engulfing Pattern). Basically the Outside Bar is a continuation pattern. Here it would be a reversal signal. I do not really differentiate between an engulfing pattern or an outside bar. What counts is the engulf. But here the Bullish Engulfing Pattern is not confirming. We have two narrow candles. However, the market likes to test levels. The next relevant level is marked with the two red horizontal lines and is resting at a level of interest. The trend is bullish with a series of higher highs and  higher lows.

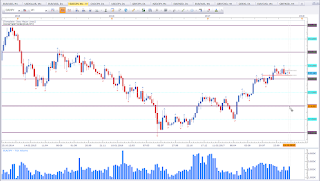
EUR vs JPY

Mixed signal.

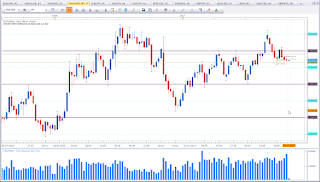
EUR vs JPY W1
This is the weekly chart of EUR vs JPY. This asset is still trading inside the narrow congestion zone. It is well worth to keep an eye on this asset.

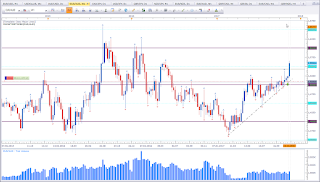
AUD vs CAD

Mixed signal.

Weekly chart of AUD vs CAD
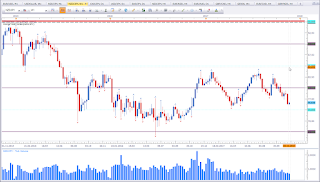
AUD vs CAD W1
This is the weekly chart of AUD vs CAD. Price is at an interesting level. Price attempts to break a swing low but failed so far. We see a test of a level of interest. Last week closed as an Indecision Candle. This catches my interest. 

NZD vs CAD

Mixed signal.

Weekly chart of NZD vs CAD
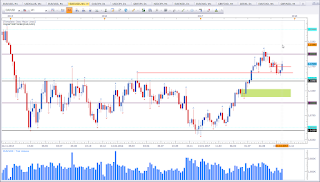
NZD vs CAD W1
This is the weekly chart of NZD vs CAD. Price failed to break the swing low and is at a level of interest. It is worth to keep an eye on this asset as well.

Cross-Currency-Analysis

AUD vs CAD and NZD vs CAD are at a level of interest. There are no setups yet, but if you plan to trade any of these pairs, you might want to look at AUD vs NZD first. AUD vs NUD did print a Bullish Outside Bar, which is a bullish signal. Hence AUD appears stronger compared  to NZD. So if I were to trade any of these two assets, I'd put more focus on AUD vs CAD.

If you have any questions or would like to give feedback, please leave them in the comments section below.

Happy Trading,
TT
Sonntag, 19. November 2017

Setups for the week ahead 20.11.-24.11.17

EUR vs USD

Mixed signal.

Weekly chat of EUR vs USD
EUR vs USD W1
This is the weekly chart of EUR vs USD. Basically we have a bullish setup with a modified Morning Star Pattern. However, price was not able to close above the big bearish candle, which keeps me alert. I'll keep an eye on this asset. Maybe we will not see the test of the black horizontal line that I would love to see. A look at the Dollar Index might give some clues.

USDOLLAR

Mixed signal.

Weekly chart of USDOLLAR
USDOLLAR W1
This is the weekly chart of FXCM USDOLLAR Index. Price formed an Indecision Candle at a level of interest. This may indicate potential strength. The 10 level proves to be relevant again. As long price is not able to violate the 10 level, the bias will remain mixed to bullish. This diminishes the potential bullish outlook on the asset above (EUR vs USD).

EUR vs CAD

Mixed signal.

Weekly chart of EUR vs CAD
EUR vs CAD W1
This is the weekly chart of EUR vs CAD. With the fifth attempt price managed to close above the 1,50 level. This is basically bullish. However, resistance at 1,5250 level is not far. Hence the label "mixed signal".

EUR vs NZD

Bullish bias for the week.

Weekly chart of EUR vs NZD
EUR vs NZD W1
This is the weekly chart of EUR vs NZD. Price performed a strong bounce of a support level (red parallel lines) and a close above the 1,70 level. This puts my bias in favour of the bulls. We have all indications of a strong market. 

EUR vs JPY

Mixed signal.

Weekly chart of EUR vs JPY
EUR vs JPY W1
This is the weekly chart of EUR vs JPY. Price is in a congestion zone. This catches my attention. Once price breaks out, it will move far. So stay alert on this asset. Last week did close as a Rejection Candle. But I don't put much emphasis on the last week candle. Price is still above support (red horizontal line). As an aggressive approach, I'd like to see a close above or below the black dottet lines. Price has moved about 2.000 Pips without a pullback. This is not a guarantee for a move south, but it is something to consider if you want to trade support.

EUR vs AUD

Mixed signal.

Weekly chart of EUR vs AUD
EUR vs AUD W1
This is the weekly chart of EUR vs AUD. Price made a strong close above the 1,55 level. Price formed an ascending triangle that got broken at the same time. This is a bullish signal. However, price stopped at a level of interest. We may see a pause/reaction at the current level.

If you have any questions or feedback please leave them in the comments section below.

Happy trading,
TT

Sonntag, 12. November 2017

Setups for the week ahead 13.11.-17.11.17

EUR vs USD

Mixed signal.

Weekly chart of EUR vs USD
EUR vs USD W1
This is the weekly chart of EUR vs USD. Price is testing the red support level. But we have the beginning signs of a trend shift. I am not interested in bullish setups. Last week failed to violate the previous high. What I said last week about this asset remains valid. See here for last week analysis on this pair.

CAD  vs JPY

Mixed signal.

Weekly chart of CAD  vs JPY
CAD  vs JPY W1
This is the weekly chart of CAD  vs JPY. Price is at an interesting level. Last week did close as a Doji. On a lower timeframe price is testing the bottom of a range level. Either this pair formed a lower high, or we see a violatin of the last week low, which would be a violation of the support level created by the previou swing high that price is testing currently. Either way, this is an interesting asset to keep an eye on.

AUD vs NZD

Mixed singal.

Weekly chart of AUD vs NZD
AUD vs NZD W1
This is the weekly chart of AUD vs NZD. Price is at a level of interest. It is worth to keep an eye on this asset. Price has made successive higher highs and may now form the next higher low.

EUR vs NZD

Bullish bias for the week.

Weekly chart of EUR vs NZD
EUR vs NZD W1
This is the weekly chart of EUR vs NZD. Price formed a Hammer at a level of support. Some traders may call this a Hanging Man since price has moved up already. But we are making higher highs and higher lows. And recently we had a violation of a previous high that got tested now (see the two red horizontal lines). We have an established bullish trend and price is giving a bullish signal at a level of interest. This puts my bias in favour of the bulls.

If you have any questions or feedback, please leave them in the comments section below. 

Happy trading,
TT

Montag, 6. November 2017

Setups for the week ahead 06.11.-10.11.17

EUR vs USD

Bearish bias for the week.

Weekly chart of EUR vs USD
EUR vs USD W1
This is the weekly chart of EUR vs USD. Price did violate support and last week formed an Indecision Candle inside the previous one. The upper wick shows rejection of the previous support level. I am not keen on trading this asset. I want to see a test of the black horizontal line or better a test of the green rectangle. These are my target areas to look for setups.

XAU vs USD

Mixed signal.

Weekly chart of XAU vs USD
XAU vs USD W1
This is the weekly chart of Gold. Price is at an interesting level. We are now at a decision point. A violation below the green zone is bearish. A bullish weekly close would be signs of strenght. I need to reevaluate at the end of the week. We may see interesting moves soon.

EUR vs JPY

Mixed singal.

Weekly chart of EUR vs JPY
EUR vs JPY W1

This is the weekly chart of EUR vs JPY. Price appears to top out. The trend is bullish, however the bulls appear to run out of steam. We may see a correction of the last leg up.

I hope you enjoy the weekly setups. If you have any questions or feedback. please leave them in the comments section below.

Happy trading,
TT