Sonntag, 28. Mai 2017

Setups for the week ahead (29.05.-02.06.17)

EUR vs USD

Mixed signal.

Weekly chart of EUR vs USD

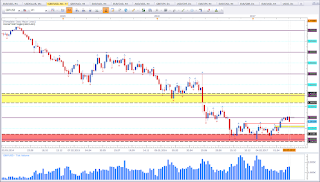
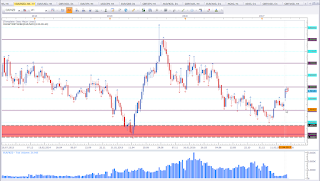
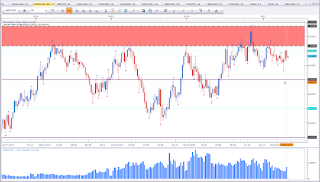
This is EUR vs USD weekly chart. Last week I was talking about this pair (here). Basically the bias has not changed. The trend is still bullish. Price now seems to be bouncing off a resistance level. This level is not far from the range top which I am expecting to get tested. Being close to resistance and having the Indecision Candle with a rather long upper wick at resistance, I am not much inclined to look for long setups. Chances are increased to see a pullback from current levels. I will get highly interested in EUR vs USD when price is at the extremes of the range. So this asset is very worth to keep an eye on.

EUR vs CAD

Mixed signal.

Weekly chart of EUR vs CAD

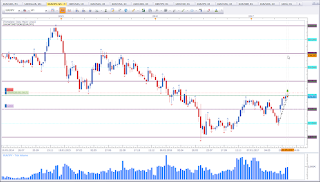
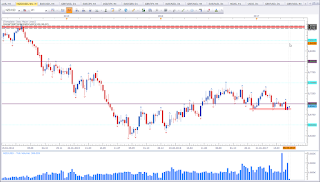
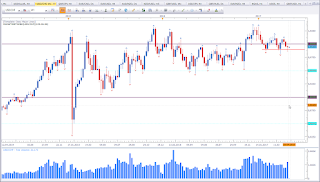
This is EUR vs CAD weekly chart. Above 1,50 I am bullish. But last time price was at current levels, price pushed violently down. Last week formed a Dark Cloud Cover at a level of interest. This is a bearish reversal pattern. We may see the beginning of a pullback from the last bull move. A weekly close below 1,50 would confirm the bears and we should see a move down probably to around the 1,45 area. But time and price will tell.

EUR vs NZD

Bearish bias for the week.

Weekly chart of EUR vs NZD

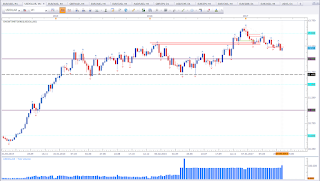
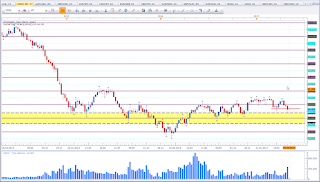
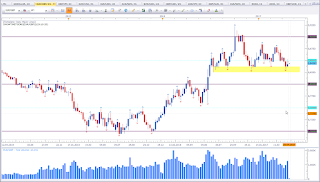
This is EUR vs NZD weekly chart. The weekly medium trend is bullish with two higher highs and two higher lows. However, price formed a Bearish Engulfing Pattern with a close below 1,60 together with a bounce off a previous low. This sets my bias in favour of the bears for the week. I am aware that price is close to a previous range top level, which may cause trouble for the bears. But a setup is a setup. And the setup sets my bias in favour of the bears until proven wrong.

GBP vs USD

Bearish bias for the week.

Weekly chart of GBP vs USD

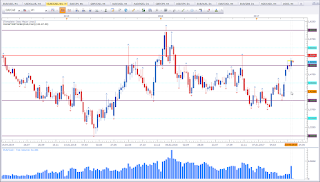
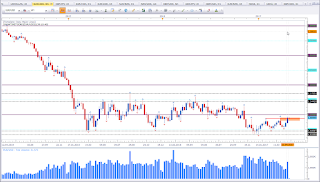
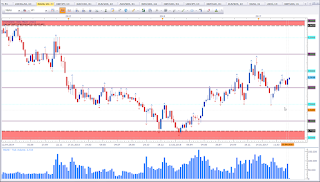
This is GBP vs USD weekly chart. At first I wanted to state my bias is mixed. However, a setup is a setup. We have a bearish setup. Last week closed as a Bearish Engulfing Pattern. This is a bearish reversal pattern. The location is also good. We have a previous low and a close below 1,30. This puts my bias in favour of the bears. Let me refer here to the cross currency anaylsis at the bottom of the page.

EUR vs JPY

Bearish bias for the week.

Weekly chart of EUR vs JPY

This is EUR vs JPY weekly chart. Last week formed a Tweezers Top with a Shooting Star as the second candle. This puts my bias in favour of the bears. Price did break a swign high. But the break above is rather weak and a sign for a toppish structure.

USD vs JPY

Mixed signal.

Weekly chart of USD vs JPY
 
This is USD vs JPY weekly chart. Whatever I wrote last week about this asset is valid this week (see here). Last week did form a Doji inside the previous week. A Doji could be looked at as a reversal pattern. Here the Doji formed at a support level which would indicate bullishness. However, the Doji is inside a bearish reversal pattern. A break of the Doji on either side could be taken as a sign but that would be an aggessive approach.

AUD vs USD

Bearish bias for the week.

Weekly chart of AUD vs USD

This is AUD vs USD weekly chart. Price is in the middle of the weekly range. I do not like to trade inside the range. However, price shows a bearish trend inside the range. Last week did form a Shooting Star and is bouncing off a low that got broken. The 0,75 level proved to be significant. This level may be the new lower high. As an odds enhancer we my want to have a look at the USD-Index which is done at the bottom of the page.

EUR vs AUD

Mised signal.

Weekly chart of EUR vs AUD


This is EUR vs AUD weekly chart. Price made a strong move up since mid April. Markets do not run in straight lines. Last week closed as an Indecision Candle at a resistance level. This transfers to not looking for long oppotunities. I am more interested in bearish setups. The Indecision Candle itself is not a setup. However, this formation indicates a possible reversal. If we get a close below the Indecision Candle, we will have the bearish setup.

GBP vs AUD

Bearish bias for the week.

Weekly chart of GBP vs AUD

This is GBP vs AUD weekly chart. Last two week we had a congestion. Last week did break out to the downside. This sets my bias in favour of the bears.

FXCM USDOLLAR

Bearish bias for the week.

Weekly chart of USDOLLAR

This is FXCM USD-Index weekly chart. Price is making lower lows and lower highs. The distance between the lows and the highs is not big which may be a sign of weakening bears. But as long this behaviour does not change, the bias is bearish. I did place a decending trendline  highlighting the immediate trend. We did have a break below the most recent low recently and price is testing this low. We can still argue that Price is in the vicinity of support and look at the Indecision Candle as a reversal pattern. However, I need a close above the trendline as a first sing of a resumption of the bulls. As long price is not able to close above the trendline, which should come in with a close above the lowest high, the bias remains bearish.

Cross-Currency-Analysis

This is an interesting week.
Earlier I made a reference on GBP vs USD to this section of the weekly analysis. EUR vs USD and GBP vs USD are strong positive correlated. That means, you do not want to short one pair and go long the other pair. While my bias on EUR vs USD is mixed, I have a bearish bias on GBP vs USD. Now we need to have a look at the USD-Index to help us. The Index is bearish. Refer to the above chart. Last week did pull back to test the support level that got broken. As long USD is weak, I am not interested in shorting GBP vs USD. Same applies for the bearish bias I have about AUD vs USD. At this stage we cannot know if GBP vs USD and AUD vs USD are early indications for USD stength. If so, we should see a strong USD. That would be still inline with my view about a test of 1,10 in EUR vs USD and the bearish bias I stated above about the GBP vs USD and AUD vs USD.

Maybe other assets may give more insight. Looking at EUR price is at resistance across a couple analized pairs. While I have a bearish bias on EUR vs NZD and EUR vs JPY my bias is mixed on EUR vs CAD and EUR vs AUD. However, EUR vs CAD and EUR vs AUD are at a level of interest. While we have a reversal pattern on EUR vs CAD I am waiting for the weekly close to confirm the bears. This transfers to a rather weak EUR, which puts weight in favour of a pullback in EUR vs USD (meaning a test of 1,10).

Looking at AUD, I have a bearish bias on GBP vs AUD. This indicates AUD strength. However, we need more assets to draw conclusions. EUR vs AUD is at a resistance level and formed an Indecision Candle. While this formation alone is not really a setup, it indicates possible AUD strength and EUR weakness. This is in contrast to the bearish bias on AUD vs USD, which indicates AUD weakness.

The Cross-Currency-Analysis can get pretty complicated as seen above. This form of analysis is mainly to help in the decison making process. My trading decisions are not based on this form of analysisn. But I like to draw conclusion across other currencies to enhance the odds of my trading ideas.

Thank you for reading. If you have any questions, please leave any questions in the comments section below.

Happy trading,
TT

Montag, 22. Mai 2017

Setups for the week ahead 22.05.-26.05.17

EUR vs USD

Bullish bias for the week.

Weekly chart of EUR vs USD

This is EUR vs USD weekly chart. Price did break above the 1,10 level and most probably is going to rest test the range resistance level. The big range is marked with the grey rectangle. This asset did exactly what I was expecting last week (see here). With the strong close above 1,10 my bias is bullish. Price is showing all signs of a healthy trend. Chances are good we see a test of 1,10 followed by a run to 1,15 where I will have to reevaluate the market situation.

EUR vs CAD

Mixed signal.

Weekly chart of EUR vs CAD

This is EUR vs CAD weekly chart. Price did close nicely above 1,50 which would be a bullish indication. However, Price was not able close to above the wick (two candles to the left). To be bullish, we do not want hesitation breaking highs. Together with the red line highlighting a level of interest, the market structure suggests to be topping out. This is not a level I am interested in bullish setups. I am rather on observer mode on this market. We may see a rather strong pullback from the current level. I need to see the weekly close to establish a bias. I tend to be bearish below the red line. 1,45 area seems to be the most likely level for the pullback.

CAD vs JPY

Mixed signal.

Weekly chart of CAD vs JPY

This is CAD vs JPY weekly chart. The rejection of the 80 level suggests bullishness. The question now is, was the 80 level the end of the pullback? We have first signs of a trend shift. While this asset made lower lows and lower highs from 105 to 75, it now made a new high. Now we need to identify a higher low. This may have been at the 80 level. They say "only the ealry bird catches the worm". But in trading the early bird falls most often prey to the predator.

NZD vs CHF

Bearish bias for the week.

Weekly chart of NZD vs CHF

This is NZD vs CHF weekly chart. Last week I had a mixed bias. Last week close did show its bearish hands. Based on the market structure I see a good chance that price wants to test the 65 level. I am not a breakout trader, so I will look for setups on pullbacks.

USD vs JPY

Mixed signal.

Weekly chart of USD vs JPY

This is the weekly chart of USD vs JPY. This asset is tricky. The overall picture is not clear at the moment. Either the overall picture is bearish and the strong up move was a strong pullback. Or the strong up move was a shift of trend and we should see a break of previous highs. The balck lines marking the low, the high and a higher low highlight a possible trend shift. What we currently see is a Bearish Engulfing Pattern which is a bearish setup. Micro structure is bearish with lower lows and lower highs. Being close to support I am not inclined to take a short trade with a break below the low of the Bearish Engulfing Pattern. The rather long lower wick of the engulfing candle shows signs of support above 110.

USD vs CHF

Bearish bias for the week.

Weekly chart of USD vs CHF

This is the weekly chart of USD vs CHF. Price did break out to the downside as indicated last week. This puts my bias in favour of the bears.

Happy trading,
TT

Montag, 15. Mai 2017

Setups for the week ahead 15.05.-19.05.17

EUR vs CAD

Mixed signal.

Weekly chart of EUR vs CAD


This is EUR vs CAD weekly chart. Price is at a level of interest and formed a possible reversal pattern called Haging Man. Now we need to wait for a confirmation. I like the level and the potential for the short side, that's why this pair is listed this week.

NZD vs CHF

Mixed signal.

Weekly chart of NZD vs CHF

This is NZD vs CHF weekly chart. Price did break out of a range and did test the breakout level. The long upper wick shows resistance of higher prices. I prefer to see the long upper wick at a high. But here it confirms resistance. I do not like CHF pairs but this is listed here, because the level is cofirmed nicely.

EUR vs JPY

Mixed signal.

Weekly chart of EUR vs JPY

This is EUR vs JPY weeky chart. Price is at an interesting level and formed a Doji. This Doji appears as a reversal pattern, But I see the possbility that this Doji is confirming the support level of the broken high. There is still the possiblilty of a strong upward move and the Doji is just a consolodation. The weekly close will shed some light.

USD vs CHF

Bullish bias for the week.


This is USD vs CHF weekly chart. Price formed a Bullish Engulfing Pattern at support and made a close above parity. This is a bullish sign. However, I do not like the fact that there is a rather long upper wick, which confirms the decending Trendline. This pair formed a decending triangle. A decending triangle tends to break to the dowside. Not always but there is a tendency. This diminishes the outlook of the bullish reversal pattern.

GBP vs AUD

Mixed signal.

Weekly chart of GBP vs AUD


This is GBP vs AUD weekly chart. Price formed an Indecisin Candle the 1,75 level slightly below an untested resistance level. This may result in a reversal. Or we see price consolodating here and move higher after breaking out to the top side. We have a first break of a high, which is the first sign of a bullish trend. Price action suggests a pullback at least a pause. I am bullish this pair, but for the week I am rather on the sideline until I see something obvious.

Happy trading, 
TT

Montag, 8. Mai 2017

Setups for the week ahead 08.05.-12.05.17

EUR vs USD

Mixed signal.

Weekly chart of EUR vs USD

This is EUR vs USD weekly timefame. With the break of the previous high, we do have all signs for a bullish trend within a big range marked with the black dotteted line. We have successive higher lows and a higher highs. Price was not able to violate 1,10. Based on market structure, we should see a test of 1,15 sooner or later. At this level, we may see some ranging. As long price stays above the previous high I am bullish. The bias is neutral below 1,10. To avoid confustion, I will get interested in bullish setups as price approaches the support level (the recently broken high) and ignore short setups.

AUD vs CAD

Mixed signal.

Weekly chart of AUD vs CAD

This is AUD vs CAD weekly chart. as mentioned the previous week, price did run to the yellow zone (see here). Price did run to the resistance level and bounced off it. We have a confirmed Hanging Man at a top and a two candle reversal pattern (Bearish Engulfing Pattern). Market structure suggests rather bearishness as price was not able to violate the resistance zone and bounced off rather strongly. Price was not able to form a new high (not even by a signle pip). As long price stays between the yellow zone and the parity level. Price may try a second attempt to break resistance. As long price has not violated the previous low, the current bullish trend is valid. I am neutral above 1 and below the yellow zone. Only as price approaches one of these levels will I get interested in this asset.

EUR vs NZD

Mixed signal.

Weekly chart of EUR vs NZD

This is EUR vs NZD weekly chart. Last week did close as a Doji at 1,60. This level has been support and resistance in the past. We have a bullish pair. Price did run strongly north since the first half of March. The trend is bullish. But we may see a pullback starting at this level. I'll keep an eye on this asset.

GBP vs USD

Mixed signal.

Weekly chart of GBP vs USD

This is GBP vs USD weekly chart. Simmilar to EUR vs USD we have a structure shift. Price is making successiv higher lows and broke a previous high. Last week candle looks like a Hanging Man. A Hanging Man formation is a bearish reversal pattern. But this pattern needs confirmation. A close below the body will cofirm the pattern and would signal a short setup. Currently the lower wick can signal both, a rejection of lower prices or signal bearishness. The level is interesting as we may see a pullback from this level. I do not have clear signals to establish a clear bias but see a good chance for a retracement.

NZD vs USD

Mixed signal.

Weekly chart of NZD vs USD

This is NZD vs USD weekly chart. Price is was not able to violate the support level. I talked about this level last week (here). Currently I am neutral to bearish this asset. As long price is below 1,70 I am rather bearish. Only a close above the previous bearish candle will make me reevaluate. But as long price is not able to violate the support level, I am neutral. What may happen this week is, a test of 1,70 and the break of support. But we don't know yet. Time and price will tell.

AUD vs USD

Bearish bias for the week.

Weekly chart of AUD vs USD

This is AUD vs USD weekly chart. Price did close below 0,75. This puts my bias in favour of the bears. But I do not really like how the candle closed. But what I see is a violation of a previous low and a close below 0,75. This puts my bias in favour of the bears. We may see a test of resistance (previous low) though. A close above last week candle high will neutralise the bearish bias.

USD vs CAD

Mixed signal.

Weekly chart of USD vs CAD

This is USD vs CAD weekly chart. This pair did catch my attention after quite some time. Price was finally able to violate resistance (yellow zone). This is bullish. However, we have a pinbar with nothing really to the left. This is a strong signal. This may signal that we did have a fake break. But price is still above support (former resistance in yellow). It is very worth to keep an eye on this pair. I will treat this asset very cautiously this week. Maybe with the weekly close we'll get a clear signal.

US Oil

Mixed signal.

Weekly chart of US Oil

This is US Oil weekly chart. Price did violate support (red line). But the violation is not really a strong violation. At the same time price is rejecting support (yellow zone). We may see a bounce and higher Oil prices from here. The 45 level is key. Either we see a break or a confirmation of this level.

Happy trading,
TT
Montag, 1. Mai 2017

Setups for the week ahead 01.05.-05.05.17

First of all, let me excuse the late analyisis. I was so busy over the weekend, I didn't get to do the anylysis on time. As we have reduced trading activity due to labors day, this should be a good chance to take off from trading and focus on studies and analysis alone. That's my aim for the week.

As always, the weekly analyis is mainly designed as a journal for myself. However, views are shared publicly. This is by no means an invitation to take positions based on my views. I am no financial advisor, nor am I suggesting to trade my setups. This is merely a tool to study and understand the markets.

Coming to the setups for the week.

EUR vs USD

Bullish bias for the week.

Weekly chart of EUR vs USD

This is EUR vs USD weekly timeframe. Price did break the resisatance level that I had an eye on. With the break and close above the red line my bias switched to bullish. Market structure suggests a test of 1,15. Do not get this wrong. This does not mean we'll see 1,15 this week, First this pair needs to clear the 1,10 level. Time and price will tell.

AUD vs NZD

Bullish bias for the week.

Weekly chart of AUD vs NZD

This is EUR vs NZD AUD vs NZD weekly timeframe. Price is showing sings of a healthy trend upwards. We have higher high and steady higher lows. Price formed a Bullish Engulfing Pattern on top of a previous resistance level which acts as support now. If the trend continues we should see a beak of the last swing high which would come in with a break and close above 1,10. I have a bullish bias, however stay alert as price is close to 1,10.

NZD vs CAD

Mixed signal.

Weekly chart of NZD vs CAD


This is NZD vs CAD weekly timeframe. Price formed a Dark Cloud Cover at 0,95. This is a bearish setup. However market structure shows struggle to move lower and struggle to move higher. So I'd rather opt to stay on the sidelines until price shows me its true intentions. We have support below, that I have talked about in earlier posts (here). The lower highs suggest rather bearish pressure. And being close to the ATH (red zone above) adds up to the bearishness of the market. 

GBP vs USD

Mixed signal.

Weekly chart of GBP vs USD

This is GBP vs USD weekly chart. Price did break above the range with a healthy bullish candle. This is bullish. But now price is testing the next resistance level. So I stay alert on the sidelines. We may see a pullback from this level. A breakout will add more bullishness. But be aware of potential bull traps. Do not jump on the break of resistance, but rather excersize patience and let the weekly close. A look at the USDOLLAR may give more insight.

USDOLLAR

Bullish bias for the week.

Weekly chart of USDOLLAR

This is USDOLLAR weekly chart. Price formed a Doji on top of a level of interest. This pattern is a reversal pattern. Espescially if it forms at levels of interest like it does here. Price was still not able to violate the support level I highlighted last week (see here). The bullish bias on this asset would add bearishness on the GBP vs USD pair and diminish the bullishness seen on EUR vs USD. We may see a bounce off 1,10. I prefer a synthony between these three, as they have a high degree of correlatoin (i.e. EUR vs USD and GBP vs USD positive and both inverse to USDOLLAR). A close below the Doji should clear the way up to 1,15 on EUR vs USD and should come with bullishness on GBP vs USD as well. In this scenario we should see a test of the yellow zone on GBP vs USD (former ATLs).

USD vs JPY

Bullish bias for the week.

Weekly chart of USD vs JPY

This is USD vs JPY weekly chart. Price formed a three candle reversal pattern called Morning Star. Last week formed an ideal looking Morning Star Pattern. This puts my bias in favour of the bulls. If the bias on  USDOLLAR mentioned above holds true, we should see price ignore the minor resistance at 112,50 and run to 115 easily.

AUD vs JPY

Bullish bias for the week.

Weekly chart of AUD vs JPY

This is AUD vs JPY weekly chart. Price formed an ideal Monring Star Pattern. This puts my bias in favour of the bulls. Price is currently testing the minor low created December 2016. 

USD vs CHF

Bullish bias for the week.

Weekly chart of USD vs CHF

This is USD vs CHF weekly chart. Price formed a Hammer at support. This pattern puts my bias in favour of the bulls. Ideally the Hammer should have a longer wick potruding below  the low of the Bullish Engulfing Pattern to the left. However, the current Hammer confirms the support level.

EUR vs GBP

Bullish bias for the week.

Weekly chart of EUR vs GBP

This is EUR vs GBP weekly chart. Price formed an Inverted Hammer at support. This puts my bias in favour of the bulls. 

NZD vs USD

Mixed signal.

Weekly chart of NZD vs USD

This is NZD vs USD weekly chart. It is interesting to see how this asset closed right on support. Last week engulfs the two previous bullish candles. Basically this is a bearish engulfing pattern. But to be truly considered a bearish engulfing pattern, this pattern should have formed on a high. In this case, this pattern may at max confirm the bearishness. What is of more interest is the close below the 0.70 level which proved to be relevant in June and November 2016 (see here) and again this year. Now we have a violation. However, price is still on top of support and this week close may either confirm the bearishness or not. A close below is bearish and would be in line with the overall rather USD bullishness.

NGAS

Bullish bias for the week.

Weekly chart of NGAS

This is NGAS weekly chart. Price formed a Bullish Engufling Pattern above the 3,00 level. This puts my bias in favour of the bulls. 

Happy trading,
TT