Sonntag, 27. November 2016

Setups for the week ahead 28.11. - 02.12.16

EUR vs USD

Mixed signal.


This is not a setup. Price is at an interesting level. The level did hold last week. Now we need to wait and look if it is going to hold or break the coming week.

EUR vs CAD

Mixed signal.


Same situation as EUR/USD. Only price formed a small Hammer. I do not give much value to this Pinbar due to the shape and location. I'll keep an eye on this asset nevertheless.

AUD vs JPY

Mixed signal.


There is not setup yet. But price is approaching an interesting level.

USD vs CHF

Mixed signal.


We had a break out of a range. Price is hitting an interesting level. We may see a retracement back to the breakout level. The candlestick is not an ideal Pinbar / Hanging Man. However it shows rejection.

NGAS

Bullish bias for the week.


We have a strong close above 3.00, which puts my bias in favour of the bulls for next week. However, price is approaching a resistance level. Price is just at an interesting level that needs to get cleared. The close of the week might tell us more.

Note: Be aware of the many High Impact News this week. There are not many setups. The ones I listed above are the ones I consider the most interesting assets for the week ahead. I am prepared not to take any trades.

Happy trading,
TT

Dienstag, 22. November 2016

Trades I took this week 21.11. - 25.11.16

GBP vs USD


Price made a nice move south. This trade is in line with my weekly bias (click here for the weekly bias).

Update GBP vs USD


This trade was good for about 100 pips. Am out breakeven minus slippage. Looking for the next opportunity.

USD vs JPY


This trade got executed yesterday. Today I was able to move my stop to breakeven.

Update USD vs JPY


Got taken out for breakeven with slippage. 

Happy trading,
TT

Sonntag, 20. November 2016

Setups for the week ahead 21.11. - 25.11.16

EUR vs USD

Mixed signal.


Price made a strong move south the last two weeks. This is a bearish sign. But price is now at range support as highlighted in the chart above. At this point it is not possible to define a setup. Only the weekly close  will shed more light. As long support has not been violated, I'll take support as support.

EUR vs CAD

Mixed signal.

Simmilar picture as EUR/USD. EUR/CAD made a strong move south, which is a bearish sign. However, price is at support. The range is not as extended as EUR/USD though. The weekly close will shed some light.

AUD vs CAD

Bearish bias for the week.


Price made a strong move south and closed below parity. This sets my bias in facour of the bears. I will keep an eye for setups on retracements.

CAD vs JPY

Bearish bias for the week.


Price did break the recent two highs and closed above 80. This puts my bias in favour of the bulls. However, price did close right at the previous swing low, which may be a test of resistance. The trend is bearish and we may be at an interesting level for a bearish continuation.

GBP vs CAD

Bearish bias for the week.


Price bounced off the 1,70 level and formed a Bearish Engulfing Pattern.

EUR vs NZD

Mixed signal.


Basically I have a bullish bias on this asset. But because of a missing signal I label this pair as mixed signal for the week. Price is at range support just like the other mentioned EUR pairs. Additionally, price was not able to close below the 1,50 level.
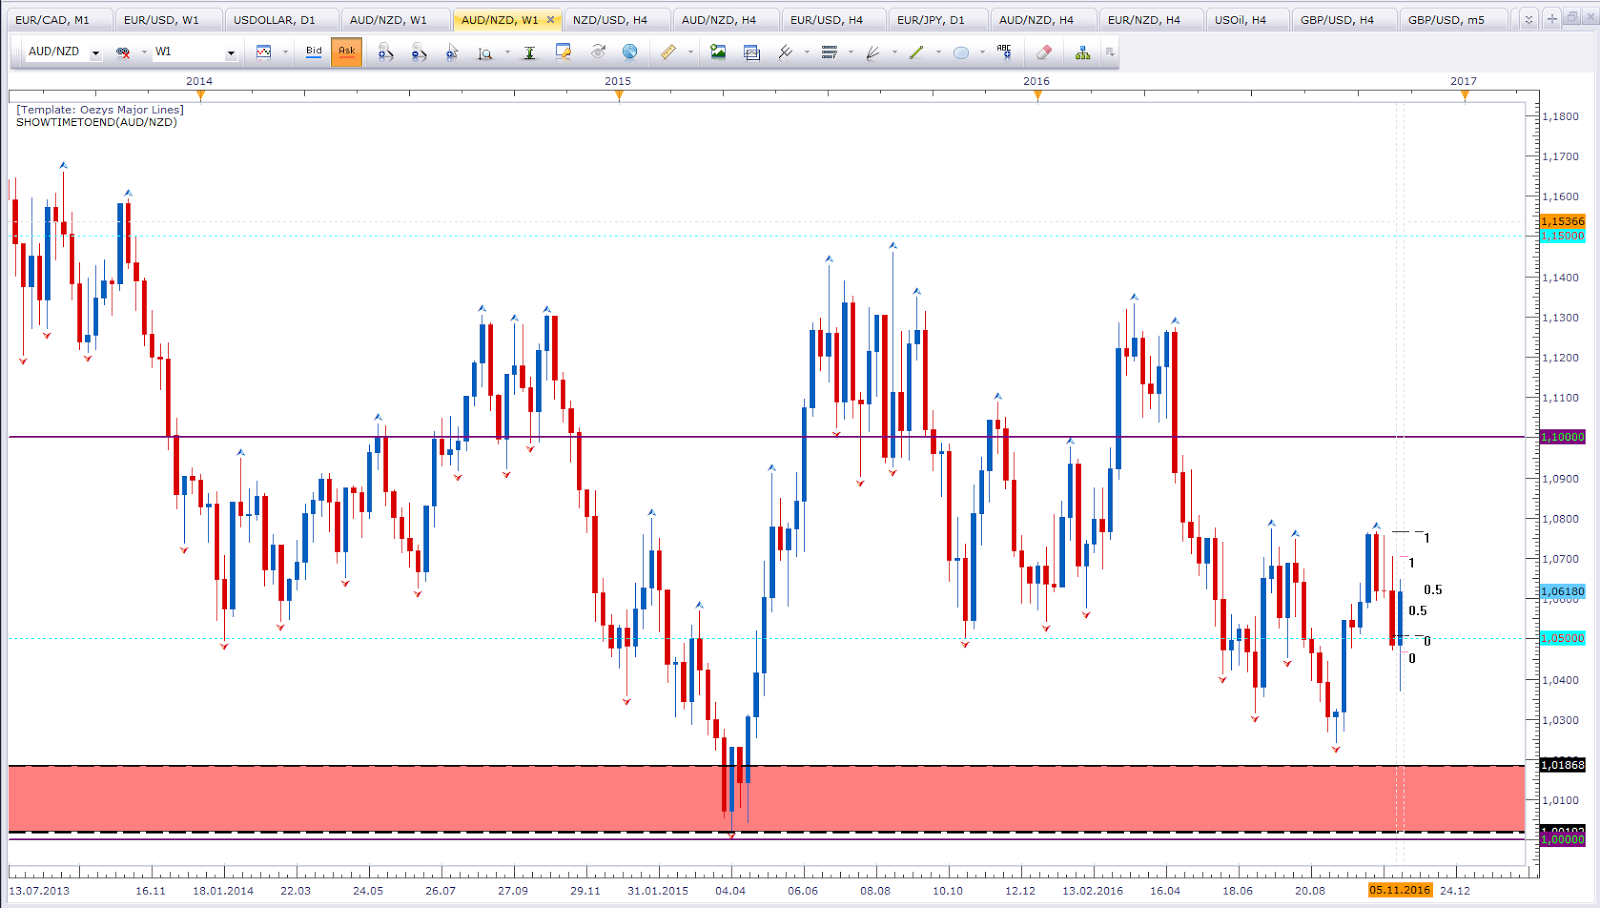
NZD vs CAD

Berish bias for the week.


Price formed new ATHs but closed below 0,95. We may be at the start of a new cycle down. The trend however remains bullish as of now.

GBP vs USD

Bearish bias for the week.


A Bearish Engulfing Pattern closing below 1,25 sets my bias in favour of the bears.

Ger30 / DAX30

Bearish bias for the week.


Last week formed a tiny candle. The shape looks like a pinbar. However, I won't refer to this candle as a pinbar. A pinbar needs a longer wick, even though the upper wick is at least double the size of the body. We have an indecision candle at range resistance, which puts my bias in favour of the bears. As long price is not able to violate and close above the recent highs, my bias is bearish. In my last post I was referring to these highs as resistance (here).

EUR vs JPY

Mixed signal.


Basically I am bullish above 115. However, price is at resistance highlighted in yellow.

USD vs JPY

Mixed signal.


Basically I am bullish this pair. However, price is not at a recent high. And the strong move up makes me expect some kind of retracement. I am not interested to go long at this point.

GBP vs JPY

Mixed signal.


We have a strong move up and a rather strong close above 135, which is bullish. However, price is aproaching a resitance level. And the trend is bearish.

AUD vs JPY

Mixed signal.


All the JPY pairs picture about the same image. However, this asset shows clear that price is having problems moving higher. Basically I am bullish above 80. But the resistance level that prive is not able to break gives me a bearish taste. As long price is not able to close above resistance, I am bearish.

USD vs CHF

Bullish bias for the week.


Price broke resisance level and closed above parity.

AUD vs USD

Bearish bias for the week.


Price did bounce off the resistance level and broke the trendline. We have a strong close below 0,75. I'll look for short opportunities on pullbacks.
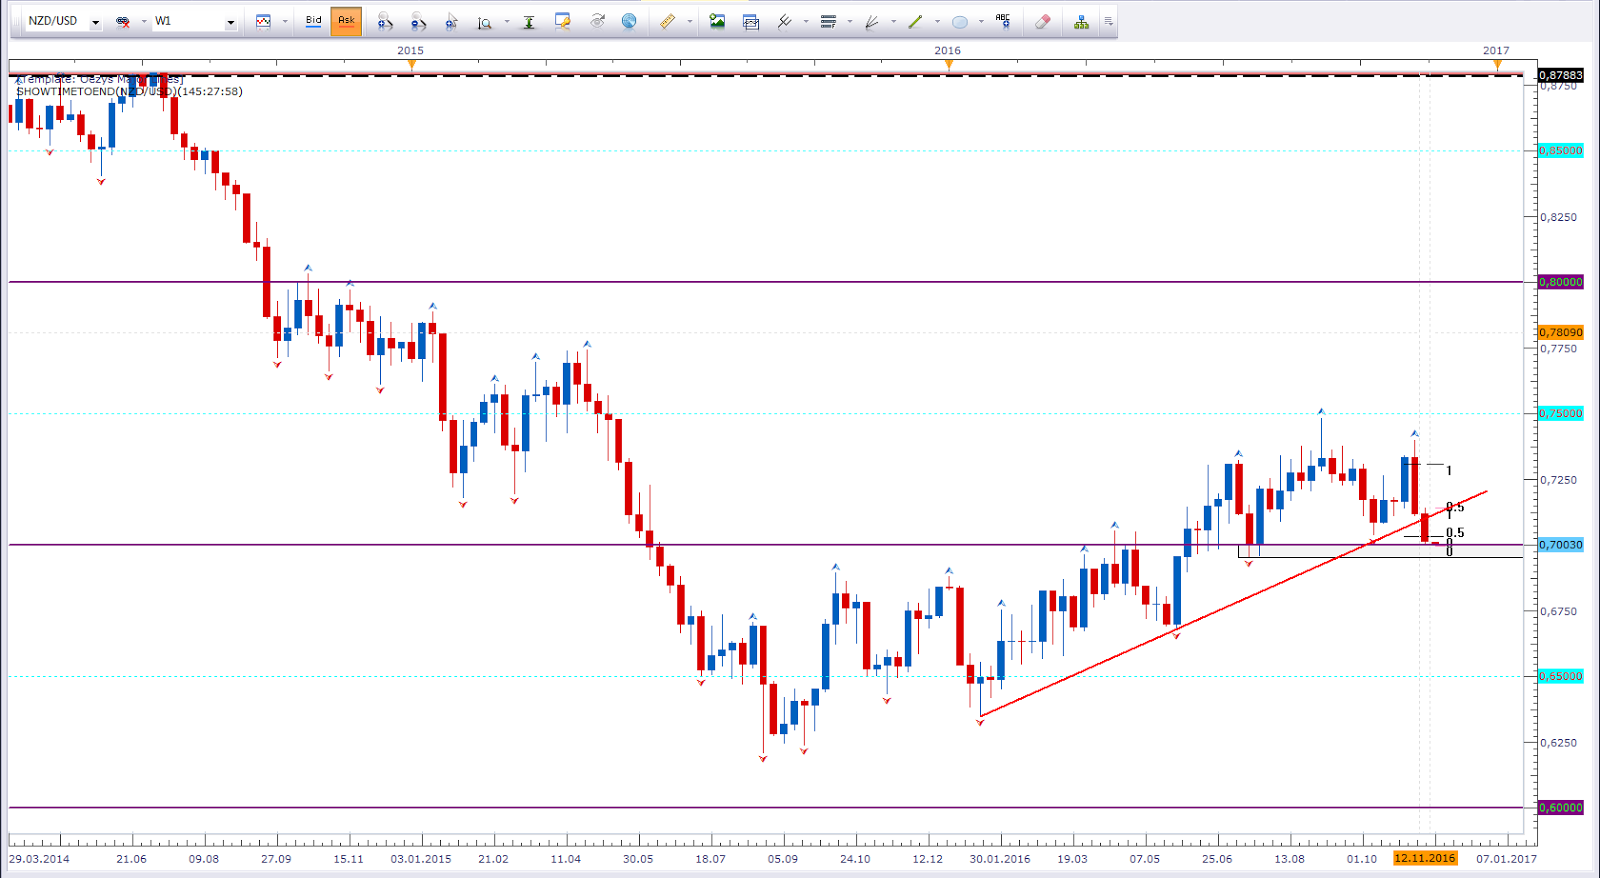
NZD vs USD

Mixed signal.


Price is at an interesting level. We have bearish signs. Bounce of resistance, followed by a break of the trendline. However, price was not able to violate the 0,70 level. There is no setup as of now, but the level is interesting. The weekly close will tell us more.

GBP vs CAD

Mixed signal.


Basically I am bearish. But there is not setup as of yet. We have a Hanging Man formation which needs to get confirmed. The downside of any Hanging Man formation is, they can be regarded as rejection candles as well. Here price is rejecting 1,65. However, price is at a resistance level and formed a Hanging Man. The weekly close will shed some light.

US Oil

Bullish bias for the week.


The Bullish Engulfing Pattern closing above 45 puts my bias in favour of the bulls. We have a bounce of the most recent low which may be the first sign of range support. Range resistance is at 50.

GBP vs NZD

Mixed signal.


We had a strong move back to former ATLs. The strong move north is a bullish sign. However, we are at resistance. The former ATLs should act as strong resistance. The weekly close will shed some light.

Happy trading,
TT

Dienstag, 15. November 2016

Trades I took this week 14.11. 18.11.16

AUD vs USD

This trade was counter my weekly bias.


Update: The trade did get stopped out.


GBP vs CAD

This pair was not listed in the "Setups for the week ahead 14.11. - 18.11.16"


Now that I took some profit, it is easy to let go the trade.

USD vs CAD

This trade was in line with my weekly bias. However, I was not convinced that we'll have a sustained move north.


Happy trading,
TT

Sonntag, 13. November 2016

Setups for the week ahead 14.11.-18.11.16

EUR vs USD

Bearish bias for the week.


We have a strong bearish close below 1,10 engulfing two previous bullish candles. Price did bounce nicely off the resistance level I mentioned in Okt 30th (here). At that time I had mixed signals but the level was marked then. Now my bias is clearly bearish for the week. We are still inside the range marked in the grey rectangle. But we have strong bearish preassure at the moment which may drive price down to range support or to 1,05 level.

EUR vs CAD

Bearish bias for the week.


We have a strong Bearish Engulfing Pattern. Some traders like to call this also a Bearish Outside Bar. For me it is more than enough to call it a Bear Eng Pat as I do not really care much about Outside Bars. The fact the second candle completely engulfs the first candle is what counts. This formation below 1,50 is a bearish sign. Price barely violated range resistance, In fact resistance is still intact. It only got shifted to the upside. I removed rectangle that used to highlight the range. The formation is more than enough. I like my charts simple and clean.

AUD vs NZD

Bearish bias for the week.


This is a difficult asset. We have a nice bounce off 1,05 level with a rather Bull Eng Pat. Price may attempt to last month high black dashed and bull  Fractal level. The closer price gets to resistance the less likely I am in taking a long position. The closer we get to 1,05 the more I get interested in a bullish setup. Ultimately we might see price get back to the ATLs on a longer perspective. However, the analyis presented here is only for next week.

EUR vs NZD

Bullish bias for the week.


Price did honour range support highlighted in yellow. We had a wick though support, but it was not enough for a close below. As long support holds I treat support as support. Untill we get a break of range, I will apply range tactics. Range resistance is at last month high or the recent bull fractal levels.

NZD vs CAD

Mixed signal.


We have a weekly violation of ATHs with a strong close above the ATH levels. That is bullish. Last week however formed a Dark Cloud Cover, which is a bearish formation. The trend is bullish. The formation may just be a pullback back to broken resistance. I did list this asset here only to keep an eye on this asset. This is a very interesting pair to keep an eye on. Price broke resistance and came back to resitance. The weekly close will show us, if it is a test of resistance. 

GBP vs USD

Bullish bias for the week.


We do not really have a strong bullish formation. But the candle with the longer lower wick and the close above 1,25 puts my bias in favour of the bulls. The lower wick shows me rejection. 

GER30 / DAX 30

Mixed signal.


The Bullish Engulfing Pattern and the close above 10.500 put my bias in favour of the bulls. However, price is also at resistance. Price did bounce off range support and moved in one week to range resistance. At resistance I will be interested in shorts. The lower price moves, the more interested will I be in longs.

USD vs JPY

Mixed signal.


Basically the strong Engulfing candle and the strong close above 105 are bullish signs. Based on this, my bias is bullish. However, price is at resistance which diminishes my bullish outlook. I will keep my eyes open for long setups on retracements. The closer we get to resistance, the less likely am I bullish. Basically I will look for both. At resistance bearish, on retracements bullish. Only the weekly close will tell me more.

GBP vs JPY

Bullish bias for the week.


There is not much to say. Price made a stong close above 130. 135 may act as resistance. But technically my bias is bullish. I will look for bullish setups on pullbacks. Price may attempt to reach 140 sooner or later.

AUD vs USD

Bearish bias for the week.


Price did bounce off the resistance level I highlighed and talked about on earlier occasions and formed a Bearish Engulfing Pattern closeing below the trendline. I do not really value trendlines much. However, price is price is very close to support at 0,75. The strong bearish close adds value to the bears but I do not like to go short close at support. If we get pullbacks, I will keep an eye on bearish setups.

EUR vs GBP

Bearish bias for the week.


Price broke old highs. We have a bullish trend and the bias is counter the trend. Price moved strongly north, it needs to pull back. After such a strong weekly move, I'd expect a consolodation. But I will keep an open eye for bearish setups on pullbacks. There is a chance price wants to test 0,85 or further below the bear fractal level.

NZD vs USD

Bearish bias for the week.


The strong Bearish Engulfing Pattern puts my bias in favour of the bears. The 0,70 level is interesting. We do have a trendline, however price may attempt to test 0,70. We may also see an end of the stong pullback of the longer term bearish trend. Again, the weekly close will shed more light.

USD vs CAD

Bullish bias for the week.


Price did break out of the range and moved higher. The close above 1,35 puts my bias in favour of the bulls. I call the last candle a Bullish Outside Bar. A Bullish Outside Bar is considered a continuation pattern.

GBP vs AUD

Mixed signal.


Basically the strong bullish close puts my bias in favour of the bulls. However, price is at an interesting level. We may see some turbulence at the grey rectangle. That's why I am not really interested in longs at the current level. If we do get a pullback, I'll keep an eye on bullish setups.

GBP vs NZD

Mixed signal.


The strong bounce off 1,70 is a strong bullish sign. However, price is not testing former ATLs as resistance. We may see a move up to 1,80 only to fall back below. The only reason I am listing GBP/NZD is, because this is an interesting asset at an interesting location.

Note:
Adding some fundamentals: NZ had an earthquake and a tsunami over the weekend, which will add further bearish pressure on NZD. We may see a weak NZD. This may be helpful with NZD/CAD and GBP/NZD where I had a mixed signal. Taking GBP/NZD as an example the setup is bullish, however close at resistance. Adding the fndamental outlook of a weak NZD would make me rather bullish GBP/NZD. Same goes for NZD/CAD.

Coming to USDOLLAR, EUR/USD and GBP/USD. These are intereting assets. While I am bearish EUR/USD I am bullish GBP/USD. Normally both are positive correlated. I do not want to go one of the pairs long while I am short the other. A look at USDOLLAR might help us out.


USDOLLAR is at range resitance. As long reistance holds, we have to treat resistance as resistance. the structure is bullish though. Inside the range USDOLLAR formed higher highs and higher lows. But failed to break above resistance. If resistance holds, this would translate to bullish GBP/USD and bullish EUR/USD. Since I have a bullish bias on GBP/USD, GBP/USD would be the better long trade. EUR/USD made a strong bearish close as mentioned above, but stopped at support. The structure is rather strong bearish. I'd rather look at GBP/USD for longs and ignore longs on EUR/USD if we get a weak USDOLLAR.

Happy Trading,
TT 


Dienstag, 1. November 2016

Trades I took this week 31.10. - 04.11.2016

DAX30 / Ger30

In line with my bearish bias for the current week, I took a trade. This is an asset that I have not traded for puite some time.


I did already take some profit and am in a free ride now.

Update:


Price made a nice move south.

AUD vs NZD


Update AUD vs NZD:


Take profit 1. Now am curious about how the week is going to close. 

Update AUD vs NZD second part of the trade:

I decided to close the remainder just before the RBNZ Rate decision and Rate Statement. Market structure gave me hints to close the trade and leave.


USD vs JPY


Update USD vs JPY H4 closed.


Happy trading,
TT