Sonntag, 29. Januar 2017

Setups for the week 30.01.-03.02.17

EUR vs USD

Mixed signal.


This is the weekly chart of EUR vs USD. This pair is in a big range with support beginning in March 2015. While I am overall bearish this asset, price did bounce off range support. This is basically a bullish sign. However, price is at resistance. Even though we EUR vs USD shows signs of bearishness with last week close, my bias stays as mixed. The current level may be the beginning of a lower high. But it is too early to say that. I will be looking for short opportunities, but am not eager to take a trade. The picture may look completely different by the close of the week.

AUD vs CAD

Bearish bias for the week.


This is AUD vs CAD weekly timeframe. Price made strong run above parity. Last week did close back below parity level. This puts my bias in favour of the bears. However, it is important to note, that price is inside the previous week range. This calls for patience when trading this pair.

CAD vs JPY

Bullish bias for the week.


This is the weekly chart of CAD vs JPY. Price formed a Bullish Engulfing Pattern above the 85 level and above minor support. This puts my bias in favour of the bulls. However, price is close to a strong resistance level highlighted with the red lines.

NZD vs JPY

Mixed signal.


This is NZD vs JPY weekly timeframe. Price did break above the red line which basically is bullish. But price was not able to break the high of the Shooting Star immediately to the left. This makes me skeptical of the breakout. The next level I want to draw your attention to is the 85 level where there is a window (gap) that has not been closed yet. We may see a test of the 85 level. I am curious about how price will react at that level, if it gets to 85 that is.

GBP vs CAD

Mixed signal.


This is the weekly timeframe of GBP vs CAD. The trend is bearish. The week before the markets witnessed a sudden GBP strength. See the big blue candle. This is a strong bullish signal. There was no follow through last week. Last week did close as a Doji at an interesting level. Ideally next week closes below the Doji. The Doji at resistance is already a signal. However, there was a strong move up prior to the Doji.

AUD vs NZD

Mixed signal.


This is AUD vs NZD the weekly timeframe chart. Even though price printed a Bearish Engulfing Pattern with a strong close below 1,05 I am skeptical of this bearish surge. Price stopped right on top of support. This asset has been a difficult one to trade. Price keeps attacking the red line but so far failed to break it. It's worth to keep an eye on this asset and observe how it will react at this level. Sooner or later it will move away from current levels. We want to be ready when it happens.

EUR vs NZD

Bearish bias for the week.


This is the weekly timeframe of EUR vs NZD. Price did bounce off the red line (referred to previously here). Price made a strong close below the previous Hammer. This sets my bias as bearish for the week. However, it is important to note that Price is now at the support of the previous low. The trend is bearish and I see a high likelyhood of hitting the ATLs. We'll see how the week will close got get more clues about the possible future path.

NZD vs CAD

Mixed signal.


This is NZD vs CAD weekly timeframe. There is not really a setup to base a bias. However, I am rather bearish. Price is testing the bottom of the ATH zone and formed an indecision candle with long upper and lower wicks (High Wave Candle). Looking to the left we see many candles with long upper wicks at this level. This shows me resistance entering this zone. A close below the 0,95 ideally below the low of the High Wave Candle will confirm the bears.

EUR vs JPY

Mixed signal.


This is EUR vs JPY weekly timeframe. Price is at resistance. Last week candle can mean two things. Either last week candle shows a rejection of lower prices, coming in by the Piercing Pattern. Or last week candle shows signs of a reversal as it can also be a Hanging Man. This shows that an isolated view of a Candlestick has little meaning. The Market Structure and Market Environment need to be regarded as well. Since price is at a resistance level there is a higher likelyhood of a reversal. But a Hanging Man formation needs to get confirmed. Hence, my bias is mixed.

USD vs JPY

Bullish bias for the week.


This is the weeky chart of USD vs JPY. Price did print the same candle as EUR vs JPY. However, price is bouncing off of a previous congestion zone dating back to Febuary/March 2016 and made a close above 115. But it is imporatant to note, that price failed to close above the previous Indecision Candle. And price is inside the Mother Candle (two candles back). As long the lower wick is not violated my bias will remain bullish. This view is in conflict of the Hanging Man of EUR vs JPY. As both are positive correlated one asset my be used as a leading indicator. Due to the amount of important news coming in this week, we may be well advised not to trade this asset or EUR vs JPY.

AUD vs JPY

Mixed signal.


This is AUD vs JPY weekly chart. Price did break and close above the red line. However, price is inside the wick of the Shooting Star hence in the vicinity of resistance. A close above the Shooting Star will make way for a move up to 90 Level which is the next level of interest. A close below will confirm the Hanging Man. So we need to exercise patience if we want to trade this asset.

USD vs CHF

Mixed signal.


This is USD vs CHF weekly chart. Price is testing a former range resistance which should act as support now. Last week candle closed as an Indecision Candle which also showed signs of rejection. This is in line with the Doji at resistance on EUR vs USD. A close above the Indecison Candle will confirm the bulls and we may see a move north. Whereas a close below would indicate further bearish pressure.

AUD vs USD

Mixed signal.


This is the weekly timeframe of AUD vs USD. Last week closed as a Doji at the vicinity of resistance. This Doji makes me skeptical of the previous bullish move. A close below the Doji will be a bearish signal. In the first quarter of 2016 AUD vs USD managed to break a significant high for the first time. That was the beginning of a trend shift. Since then price was not able to continue to break a high and remained below the high of March 2016.

EUR vs AUD

Bullish bias for the week.


This is EUR vs AUD weekly timeframe. Price is at support. As long support has not been violated I treat support as support.

GBP vs NZD

Mixed signal.


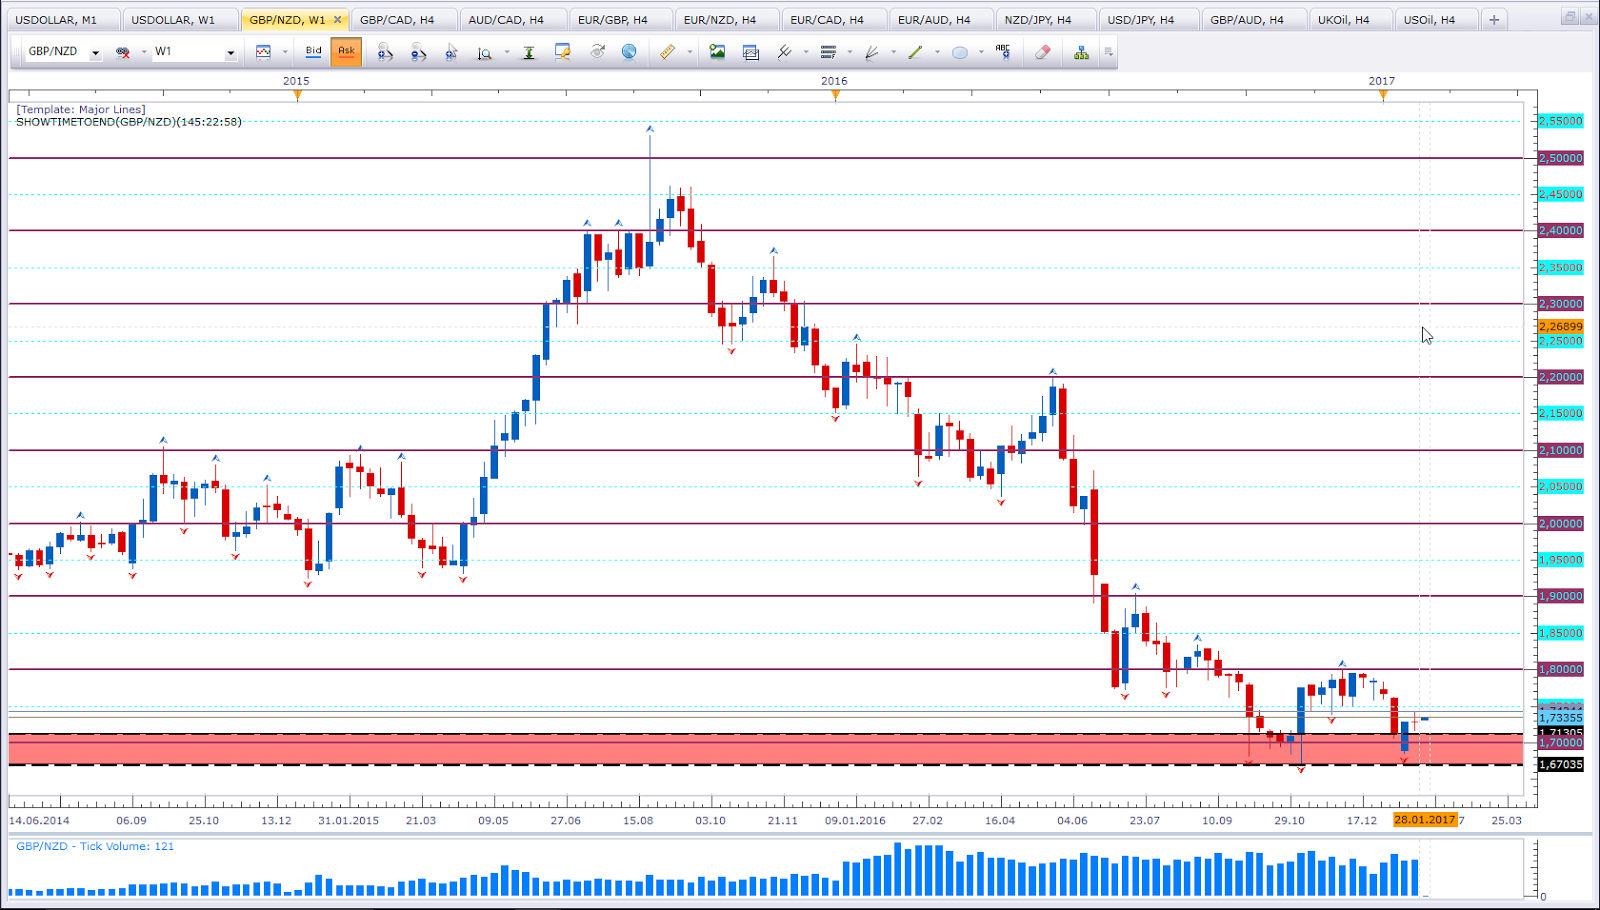
This is GBP vs NZD weekly timeframe. Price did print a Doji at an interesting level. This basically is a bearish reversal signal. However, price is at ATLs. Next week close will shed some light.

Note: The coming week there will be many high impact news. Trading during high impact news is very risky. Not taking a trade is also part of trading. It's having the position of an observer with the capital secured in the account.

Happy trading,
TT

Mittwoch, 25. Januar 2017

Trades I took this week 25.01.-27.01.17

AUD vs CAD

This trade actually got triggered last week.


Update 25.01.17

Closed the trade at a leve of interest.


EUR vs GBP


Happy trading,
TT

Montag, 23. Januar 2017

Setups for the week ahead 23.01.-27.01.17

EUR vs CAD

Bullish bias for the week.


This is the weekly chart of EUR vs CAD. Last week performed well and made a strong close above 1,40 and above the mother candle. We may see a test of resistance ahead (former lows that got broken end of last year). That means the upside move may be a limited one.

EUR vs NZD

Mixed signal.


This is the weekly chart of EUR vs NZD. Last week closed as a Dragonfly Doji. This is bullish reversal pattern. It's not really the pattern that caught my interest. It is the candle and market structure that is of interest. Price stayed below 1,50 but shows rejection of the Bullish Engulfing level from about mid December 2016.

GBP vs USD

Bullish bias for the week.


This is the weekly chart of GBP vs USD. GBP vs USD found support at 1,20. Is this the new ATL? We don't know yet. It just shows USD weakness. Once USD resumes its strength, I think we'll see lower levels. Currently we have a Bullish Engufling Pattern at 1,20. And that is bullish for the time being.

GBP vs JPY

Mixed signal.


This is the weekly chart of GBP vs JPY. GBP vs JPY did break the recent low and came back to test the low. Last week did bounce off the lows, which is a bullish sign. But price is still inside the previous week range. I'll be keeping an eye for bullish setups during this week.

USD vs CHF

Mixed signal.


This is the weekly chart of USD vs CHF. There is no setup as of yet. But price is at an interesting level. Price is currently testing former range top. I'll be keeping an eye on this asset.

EUR vs AUD

Mixed signal.


This is the weekly chart of EUR vs AUD. Price has been at support for a while. I like how last week candle closed. It just aligns nicely with the support level. This close to support, I'll be looking to trade support.

EUR vs GBP

Bearish bias for the week.


This is the weekly chart of EUR vs GBP. Price formed a rejection candle last week. A close below the previous bullish candle would confirm the bearishness. There is still a week to go for this.

USD vs CAD

Bullish bias for the week.


This is the weekly chart of USD vs CAD. Price formed a Bullish Engulfing Pattern at the level of a previous Bullish Engulfing Pattern. This sets my bias to bullish for the week.

Before I close this weeks setups, I'd like to take a look at the USD Index.


This is the weekly timeframe of the Dollar Index. After recent USD strength, price pulled back. And we are at a level of a former Bullish Engulfing Pattern. A litle below, there is the support of former highs. This suggests we may see a resumption of the USD strength some time soon.
With this in mind, I am not too strong bullish on GBP vs USD. And USD vs CHF gains more interest. We already have a bullish setup for USD vs CAD, which may be a leading sign. However, if we get a resumption of USD strength, that would further confirm the bullish setup we have on USD vs CAD.

Happy trading,
TT


Mittwoch, 18. Januar 2017

Trades I took this week 16.01.-20.01.17

US Oil


With the close below the higher low there is a market structure shift. This shift does not cancle the weekly bias, but it makes a bullish move less likely. 

Happy trading,
TT

Montag, 16. Januar 2017

Setups for the week ahead 16.01.-20.01.17

I was not able to do the weekly analyis yesterday. I had to rearrange my new computer. That took some time. Here comes my weekly anaysis.

EUR vs USD

Bullish bias for the week.


This is the weekly timeframe of EUR vs USD. Price was barely able to break support in December 2016. Last week close above the Hammer. More importantly the candle has a close near the top, which adds up more bullish signs. All these confirm support from March and December 2015. These are all reasons why I am more bullish in an overall bearish environement. The downside of this EUR vs USD is, price was not able to clear the high of the mother candle five weeks ago (marked with a greay line). If price does clear that level, there is a good chance for a run to the red line or even back to 1,10. What I see at the moment is support holding. And that defines the bullish bias.

EUR vs CAD

Bearish bias for the week.


This is the weekly chart of EUR vs CAD. My bearish bias from last week remains (see here). The Evening Star pattern I mentioned last week has not bee violated nor did price close above 1,40. Last week formed an indecision candle. I'll be keeping an eye on bearish setups this week.

AUD vs CAD

Bullish bias for the week.


This is the weekly chart of AUD vs CAD. Price showed strength last week and closed as a strong Bullish Engulfing Pattern. This asset is in an overall range like structure and price formed a bullish reversal pattern at about the mid range. We may see a test of parity in near future. Price likes to break a level and than come back to test the level. Here we may see the test of the 1,00 level.

CAD vs JPY

Bearish bias for the week.


This is the weekly timeframe of CAD vs JPY. While I had a mixed signal last week (here) I am bearish this week. Price seems to find resistance at former high and is not able to violate it. I like how price snuggles into resistance highlighted in red. The ultimate go for the bears would be the break of the most recent bear fractal. But we may be missing some pips on the way down. Currently resistance holds and I will be looking for bearish setups.

NZD vs JPY

Mixed signal.


This is the weekly timeframe of NZD vs JPY. The reason why this asset is mentioned here is, it may be setting up for something nice. Price did bounce off resistance (red line). Price is still at the vicinity of support. The 80 level is going to be key here. Either we will get a break and close below sometime maybe this week or next week. Or we will get a bounce. We won't know yet, but we will stay alert.

EUR vs NZD

Bearish bias for the week.


This is the weekly chart of EUR vs NZD. While I had a mixed signal last week, I was highlighting the importance of the red resistance line (here). Resistance did hold true. Together with the close below 1,50 I have a bearish bias this week.

NZD vs CAD

Bullish bias for the week.


This is the weekly chart of NZD vs CAD. Last week did conquer back support. Last week closed as a Bullish Engulfing Pattern with a strong bullish candle with a close near the top. It is too early to make a judgement about a possible trend. Price did violate a previous low and formed a lower low. This is the first sign of a shift in trend. A shift / change of trend does not automatically mean a shift from bullish to bearish or vice versa. The break of the recent low may have been a fake. And the micor signs seem to add weight for this assumption. Last week did engulf the previous candle. But more importantly, last week candle did close above support. This adds more weight for the bulls. So my bias is bullish this week.

EUR vs JPY

Bearish bias for the week.


This is the weekl timeframe of EUR vs JPY. Price was in a consolodation the past four weeks. Last week did complete a formation called the Tower Top. This is a formation I rarely talk about. If you look at market structure, last week closed rather strong bearish and engulfs the mother candle (counting five back from right to left).

USD vs JPY

Bearish bias for the week.


This is USD vs JPY weekly timeframe. We have the same formation as described for EUR vs JPY. What I like more on this pair is, we have a close below 115. My preference goes for this pair. But I'll take either setup, if there is a valid setup to be taken.

Nikkei 225 / JPN225

Mixed signal.


This is the weekly chart of Nikkei 225. Some brokers call it JPN225. Anyway. There is not really a setup at the moment. I am rather bullish this asset. The setup of two weeks ago is still valid. We had a Bullish Engulfing Pattern the first week of January. I didn't talk about asset before as a Bullish Engulfing Pattern at a high is not really a setup for me. What I want to highlight here is, the Bullish Engulfing Pattern has not been violated. The reason why I didn't mention this asset last week was, I do not really like a Bullish Engulfing Pattern at a high. I always disregard them. Same goes for Bearish Engulfing Patterns at lows. However, price shows support at 19.000. Last week shows price not being able to violate this level. And this support makes this asset interesting.

GBP vs JPY

Mixed signal.


This is the weekly timeframe chart of GBP vs JPY. Basically I am bearish below 140. Last week formed a strong bearish candle with a close below 140. This is bearish. However, price is sitting on top of support. The other JPY pairs are more interesting for a trade. And all are in line bearish.

AUD vs USD

Mixed signal.


This is the weekly chart of AUD vs USD. This is again a chart with no clear setup. However, the level this asset is at, is very interesting. Price is testing 125 as resistance. Either it is a successful test and we are in for a move south, or we get a break and are in for a bullish move. The candle structure suggests strength. And this is in line with an overall weak USD. More about the cross currency analyis on USD below.

EUR vs AUD

Mixed singal.


This is EUR vs AUD weekly timeframe. We are in an overall bearish market. The downside pressure is strong. However, price is at support (red line) and just above 1,40. This puts my bias on mixed status. If there is a good setup at support to go long, I might take it but with a tight leash. If there is a good setup for a short trade after a correction I might take it as well, as that would be in line with the trend. Again on a short leash. To make it short, any setup needs to be analysed critically. And if there is a trade, it will be micro managaged.

NZD vs USD

Bullish bias for the week.


This is NZD vs USD weekly timeframe. Price did break out of a consolodation and closed above 0,70. This puts my bias in favour of the bulls. The fractal level to the left may cause some turbulence. I am not really into trend lines, but you could connect the wicks on the left and draw a descending trendline. A break of the TL would add more confirmation on this scenario. I personally like how price was able to conquer back the 0,70 line as support. I first started to talk about this level in "Setups for the week 25.07.-29.07.2016. You can find it here at the bottom. It is the last asset I mention in that weekly analysis.

USD vs CAD

Mixed signal.


This is the weeky timeframe of USD vs CAD. This asset is very interesting but my least favourite to trade at the moment. Price did break a confluence of support (horizontal line and trendline). This is bearish. But price was not able to violate the Bullish Engulfing Pattern highlighted in the chart. and price is above 1,30. This is bullish. With price at support I am not looking to short this asset. But with price being below the red line and the trendline, I am not looking to go long also. We may be at the start of a range. And the current level would be range support. Range resistance is obviously the the 1,35 level with the two successive tops (look at the bull fractals). I am not interested in trading this asset as of yet. Ideally the weekly close will give us more information. But if there is a good setup at the 1,30 level, I might be tempted to take it.

GBP vs AUD

Mixed signal.


This is GBP vs AUD weekly timeframe. My overall bias is bearish. But price is at support. And this asset made a strong run south from 1,70. This pair may be correct. We are at a leve of interest where the scenario of a correction is likely. I'll keep an eye on this asset. The trend is bearish, so I'll try to get entries on pullbacks.

US Oil

Mixed signal.


This is US Oil weekly timeframe. Price is making higher highs and hier lows. We recently had a break of resistance (yellow zone) and a test of this level. This is all bullish, however there is no setup yet. But price shows signs of rejection of the level of support (yellow zone) which puts my bias in favour of the bulls. However, I see also resistance ahead. So price is just in between support and resistance, and anything can happen in between. For the reasons above I tend to be more bullish than bearish. This week close will shed more light.

GBP vs NZD

Mixed signsl.


This is the weekly chart of GBP vs NZD. Price made a run south from former ATLs and is now back at support. This asset is in an overall bearish trend. Now we need more sings of a continuation of this trend. The confirmed sign of a continuation would be the break of the new ATLs at 1,70. Since price is at support but the trend is bearish, I have a mixed signal for this week. Since I like to trade in line with the trend, I'll be looking for possibilities of berish setups on pullbacks.


Cross currency analyis.
All USD pairs I have mentioned in this weekly analysis confrim USD weakness. Looking at the USD Index


This is the USDOLLAR weekly timeframe. The chart above shows weakness at the moment. We may be in for a pullback to former high highlighted with the long red line. The small red line shows a level of minor support that needs to be taken out. With the weekly close we will see if the miner support will hold.

With EUR vs AUD sitting at support and both appearing stronger opposed to USD and having a bearish bias on EUR vs NZD, NZD vs USD might be the best option to look for a bullish setup.

Hope you like what you read. If you have any questions please place them in the comments section below.

Happy trading,
TT

Samstag, 14. Januar 2017

Emotions - Good or Bad? Part II

If you have not read the first part of the Article, you might want to do so. The first part is here.

It is key to unerstand emotions and to understand where they stem from. Understanding your emotions will help you trade better. It will help you in your decision makeing process. Losing a trade is not bad. Many of us have been taught that losing is bad. And this tought is most times transferred to trading and we think that losing is bad. In trading, however it is not necessarily bad if you lost a trade or two. There is a post about this subject. You'll find it here (in english) or here (in german).
The first and most important step to learn from mistakes is to realize one did mistakes. Only than you are able to make a change.

Now that we understand the importance of our emotions, we can take the next step. It is easy to say emotions are important when it comes to trading. Everyone knows this. But again, this is a general statement. Let me narrow down to how and why emotions are important.

Mentally and to some degree also physically our mind and our body is designed to keep us safe. That is the very reason, why pain or loss hurt us more compared to having a gain. We established that already in my previous post (here). The degree of pain we feel is stronger than the degree of joy we feel. This makes as afraid of taking a trade. And this makes us scared if the trade we took goes against us. How many times have you decided to sit on the sidelines only to see your analysis was correct and the asset did move several hundred pips in your direction? Then we decide to take the trade no matter how much we are afraid. We take the trade, because it worked well. But many times at this stage, we fail to realize that the setup may not have been as good and we end up losing the trade. And we get afraid again. First we were afraid, then we were greedy. The key point to realize is that the market does what it does. Just because a setup was working before, does not mean it has to work the next time again. We are surrounded by uncertainty. If we do not understand this, we will always fall back to old habits of being scared and greedy. Our emotions will dictate our actions.

How do I deal with this? Again, this is a personal developement. What I do may not work for you. My approach may be totally different to yours.
I let go.

There is always a reason why I take a trade. Meaning, there is always a technical reason to take the trade. As long the reason is valid, there is no reason to get out. I need a reason to get in. And I need a reason to get out. If I take a trade and it closes red - meaning it is a losing trade- it is a losing trade. The trade failed. I had a reason to get in, but it didn't work out. I don't take it personal. A losing tade does not mean that I failed. It just means that this time the setup failed. It happens. I don't take a losing trade personal. But I try to identifiy if my analyis was fraudlent. Was I impatient? Did I force the trade? Did I disregard signs of warnings? If the answer is yes to at least one of the questions, then I try to incorporate this information in my decision making process for the next trade.

I know the market does not dislike me. Nor does the market like me. The market is not a beast I need to fight. The market does not even know me nor does it even care about me. My job is to understand what the market displays on the screen. My job is to understand the special character of the asset. And than I need to trade accordingly. When I say character, I make the market appear as a person or a living being. (This alone can be a topic for itself) The market is not a living being. Each asset has its own characteristic moves. For example GBP pairs are moving more volatile compared to lets say EUR vs USD. Knowing this will help me to narrow down my fear, when the trade goes against me. This information will help me narrow down my fear of giving back pips after it moved in my favour. This information may help me deal more rational with my greed when I am in e.g. 50 pips profit and the asset I trade has an average move of 70 pips a day. I may decide to close the trade on a sign of a reversal instead of hoping for more. Or I may pass a setup because the asset already moved 70 pips in the setup direction and the asset has an average move of 70 pips a day or 100 pips a day. Fear and greed are emotions all of us have to deal with on a personal basis.

I know I have no control over the market. The only thing I may control is my reaction to what the market shows me. And my emotions may influence my actions. If I really have a bad feeling about a trade, I get out. I take what I have (be it profit or loss). In doubt stay out. Or in doubt, get out. I do not shed a tear if the trade goes in my direction after I got out. I look at the chart and try to identify what gave me stomach ache. Maybe my bad feelings comes from a valid reversal setup that makes my doubt the validity of the trade I took. Sometimes we identify a setup and we take the trade, but the trade goes against us. And this is true for our exits as well. We will never know what the market will do next. We will never have a 100% accurate analysis. This is why I trade what I see. If I see the asset making a characteristic behaviour I take appropiate acction. Even it it costs me pips.
There is not what if. The only thing that counts is - What is. 

I do not need certainty. I will never have certainty.

Hope you enjoyed reading this article. If you have any questions, please leave them in the comments section below.

Happy trading,
TT

Montag, 9. Januar 2017

Actual trades

AUD vs JPY

This is my first trade of the year. I took it based on the Hammer with high volume. Entry was on a lower timeframe.


I normally aim for a higher take profit, but the break of the last high is on thin volume. So I opt for a partial profit earlier than usual and give the remainder a chance to prove me right.

Update 12.01.17


EUR vs CAD

This is mere a set and forget trade that got triggered yesterday. My normal risk parameter is regualarly about 30 pips. But that requires me to be at the computer.


Update 12.01.17


NZD vs CAD 

This trade got taken yesterday 11.01.17. I did not have the time to post at the time I took this trade.


This is what happens at times. You get in at a good price, than the market spikes up and takes you out. As long we stay around this price level and price does not break above the upper red line, I might be looking for another opportunity here.

Happy trading,
TT