EUR vs USD
Bullish bias for the week.
 |
| EUR vs USD W1 |
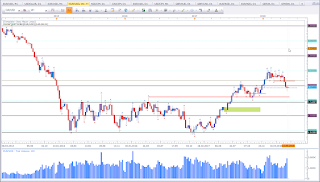
This is the weekly chart of EUR vs USD. Last week close formed a Hammer at support. This is a bullish reversal pattern. In the monthly analysis, I did talk about this asset. I did mention, that I'd like to see a correction red horizontal line. However, due to the support level price is sitting there was no clear bias. See
here for last month analysis. Having a weekly Pinbar at support puts my bias in favour of the bulls.
At this point, I'd like to draw your attention to two of my articles one about
Pinbars the other about
stop hunting.
Mixed signal.
 |
| EUR vs CAD W1 |
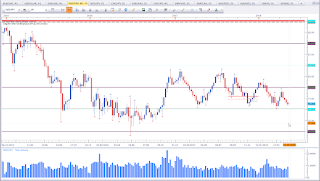
This is the weekly chart of EUR vs CAD. I did mention the 1,50 level in the monthly analysis (see
here). The weekly timeframe shows support more clear. And we see signs of reaction at support. The signs are not sufficient enough to switch the bias, but it is well worth to keep an eye on this asset and the level price is sitting at.
NZD vs JPY
Mixed signal.
 |
| NZD vs JPY W1 |
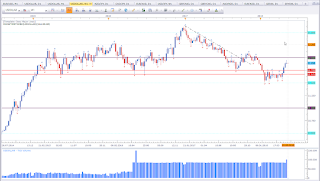
This is the weekly chart of NZD vs JPY. Price is sitting at an interesting level. This asset is hitting the current support level the fourth time now. This shows, this level is significant. Either this level holds or it breaks. One thing about support and resistance levels is they are stronger if they got tested a couple times. Eventually they will give in and fail. We never know before hand. Currently support is holding and we have an Indecision Candle at support. However, the structure of the market shows bearish pressure with successive lower highs. It may be worth to keep an eye on this asset in the near future.
Gold
 |
| Gold W1 |
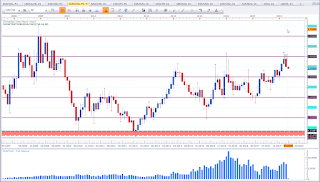
This is the weekly chart of Gold (XAU vs USD). Price is trapped between 1350 and 1300. The million dollar question is, which level is going to fail? The monthly bias is bearish. Currenlty the weekly bias does not confirm the monthly bias. I'll keep may hands on my lap, wait, and observe patiently. I am not interested in trading range support, price is sitting at.
GBP vs USD
Mixed signal.
 |
| GBP vs USD W1 |
This is the weekly chart of GBP vs USD. Price formed an Indecision Candle at a level of interest. Recent Dollar strength did break the most recent higher low. This may be the sign for a continuation of the bear trend. We'll only know once price moved. For now, we see Indecison at support. This is not enough for me to establish a bullish bias, hence I'll wait and observe. A close above or below will shed more light.
USDOLLAR
Bearish bias for the week.
 |
| USDOLLAR W1 |
This is the weekly chart of FXCM USDOLLAR. Last week did close as a Shooting Star at a level of interest. We may see a test of the red horizontal line.
AUD vs USD
Bullish bias for the week.
 |
| AUD vs USD W1 |
This is the weekly chart of AUD vs USD. Last week did close as a Hammer at a level of interest. A Hammer is a bullish reversal pattern. This puts my bias in favour of the bulls.
GBP vs AUD
Bullish bias for the week.
 |
| GBP vs AUD W1 |
This is the weekly chart of GBP vs AUD. Price formed a Gravestone Doji, which could be classified as the ultimate Inverted Hammer. A Doji is a reversal pattern. An Inverted Hammer is a bullish reversal pattern. What I do not like about Inverted Hammers is, these can also be classified as Rejection Candles at the same time. Here, we have higher highs and higher lows, which is a bullish trend. This is why I label last week candle an Inverted Hammer. This formation also formed at support. What I see is a bullish reversal pattern in a bullish trend at support. Hence, my bias is bullish.
AUD vs CAD
Bullish bias for the week.
 |
| AUD vs CAD W1 |
This is the weekly chart of AUD vs CAD. Price is at a level of interest and formed a bullish reversal pattern called Hammer. This puts my bias in favour of the bulls.
GBP vs CAD
Mixed signal.
 |
| GBP vs CAD W1 |
This is the weekly chart of GBP vs CAD. Price did close as an Indecision Candle at support. Some might call last week candle an Inverted Hammer. It is not really important how you lable candles, what is important is, what do the candles tell me. Price is at a level of interest. If price is not able to violate this level, than we have a bullish sign. Currently we see price is rejecting 1,75 but failed to violate support. Next week close will shed more light.
A word of caution. Last week close have formed many Pinbars. Those who trade only pinbars must be happy as there are many opportunities to trade pinbars. But not all Pinbars are a guaranteed success. Please read my article about pinbars (
here).
Cross Currency Analysis
With a weak bias on USD, chances have increased in favour of a bullish reversal on EUR vs USD, GBP vs USD, and AUD vs USD.
Since there have been some assets with a rather strong bias in favour of AUD, I'd be carefull with GBP vs AUD.
If you have questions or would like to give feedback, please leave them in the comments section below.
Happy trading,
TT


