Bullish bias for the week.
This is EUR vs USD weekly timeframe. Price performed a bounce of range support. Currenlty it seems like this asset formed a higher low. A bullish weekly close will confirm the higher low. My bias for the week is bullish.
AUD vs CAD
Mixed signal.
This is AUD vs CAD weekly timeframe. As there is no setup I label this asset as mixed. However, I am rather bearish this pair. The last two weeks show selling pressure with the rather long upper wicks. Last week formed an Indecison Candle with a rather long upper wick inside the previous candle. This shows me resitance to higher prices. If price does break above the previous upper wick, I will keep an eye on price behaviour at the yellow zone.
CAD vs JPY
Bullish bias for the week.
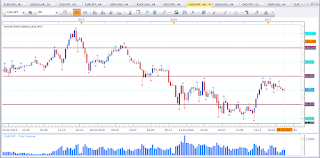
This is CAD vs JPY weekly timeframe. Price is still at support of the decending channel (flag - see here) support. As long support and previous week Pinbar has not been violated, there is no reason to switch the bias. Last week formed an Indecision Candle inside the Pinbar. A break and close above would confirm the bullishness of this asset.
NZD vs JPY
Mixed signal.
This is NZD vs JPY weekly timeframe. Currently there is no setup. However, price is at an interesting location. While I am bearish below the 80 level, price is sitting on support. The level is interesting. This makes it worth to get mentioned here.
NZD vs CAD
Mixed signal.
This is NZD vs CAD weekly timeframe. Price is approaching support. This gives me a mixed signal. The break of the previous low gives this asset a bearish touch. And I am rather bearish. However, Price is at a support level that should not be disregarded. I will keep an eye for short opportunities on pullbacks though.
GBP vs USD
Mixed signal.
This is GBP vs USD weekly timeframe. There is no setup as of yet, But price is approaching an interesting level. I will keep a keen eye on the 1,20 level.
USD vs CHF
Mixed signal.
This is USD vs CHF weekly timeframe. We do not really have a setup yet. But price behavious is suspicious. The current price action is giving this asset a bearish touch. However, there is no setup as of yet. I am observing this asset with interest.
AUD vs USD
Mixed signal.
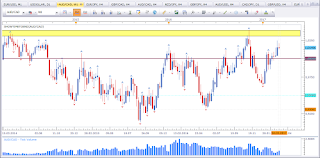
This is AUD vs USD weekly timeframe. Again an asset with no setup. However, the current level price is stitting at is very interesting. This may be the level, where we get a run back to the resistance level (yellow zone).
EUR vs AUD
Mixed signal.
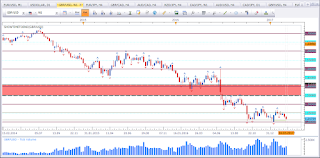
This is EUR vs AUD weekly timeframe. Price did close nicely above 1,40 which would basically be a bullish sign for me. However, price is at resistance. As long resistance has not been cleared my see mixed signals. The trend is bearish and we may see weakness kick in anytime.
GBP vs AUD
Bullish bias for the week.
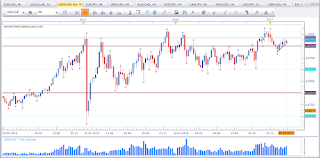
This is GBP vs AUD weekly timeframe. Last week did close as an Indecision Candle inside the Pinbar of the previous week. Support has not been violated yet. My bias remains bullish.
Before finishing the setups for the week I'd like to have a look at what I like to call the cross currency analysis. This week this will be rather difficult. But from my analyisi I get a rather weak outlook for the USD.
Happy trading,
TT


Keine Kommentare:
Kommentar veröffentlichen