Bearish bias for the week.
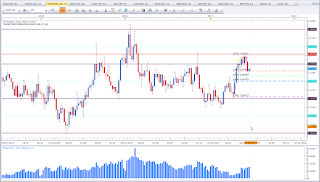
This is the weekly chart of EUR vs CAD. We have an interesting situation. The immediate market structure shows a bullish trend with hither highs and higher lows. And price is currently at a first level of interest with an Indecision Candle. If the trend is strong bullish, we should see a bounce here followed by a move up. The overall market structure however shows a rather sideways move and p rice bounced off resistance around 1,5250. Price made a solid close below the 1,50 level after the bounce off resistance. This puts my bias in favour of the bears. There is enough room until the next support level at about 1,45. Trading this asset requires to keep both aspects in mind.
AUD vs CAD
Bullish bias for the week.
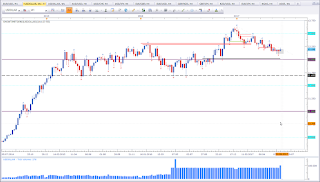
This is the weekly chart of AUD vs CAD. There was no follow through on the Morning Star pattern. Price is still at parity, which seems to be a hard to break level. All the long lower wicks show support at this level. As long support holds I'll look to trade support. Hence my bias is bullish for the week.
GBP vs CAD
Bullish bias for the week.
This is the weekly chart of GBP vs CAD. Price formed a Doji at a level of interest. Basically I am bearish below 1,70 but the Doji at support puts my bias in favour of the bulls. The current level is a potential higher low. I did highlight this level last week and said to keep an eye on this asset. (See here) This week close will be essential. A conservative approach would be to wait for the weekly close.
NZD vs CHF
Bearish bias for the week.
This is the weekly chart of NZD vs CHF. Price did break the range support level in April. Price did test the 0,70 level quickly after the break below. Price is now back again at resistance and formed a Doji. This is a make or break situation. Either resistance will hold or it will break. I'll treat resistance as resistance. That translates to a bearish bias for the week.
GBP vs USD
Mixed signal.
This is the weekly chart of GBP vs USD. Basically price action suggests a bullish bias. We have a Pinbar at support. A look at USDOLLAR may help establish a bias.
USDOLLAR
Bullish bias for the week.
This is the weekly chart of FXCM USDOLLAR. Price was not able to break the trend line last week. This diminishes the bullish outlook. Price is congested between support and resistance. The two Hammer formations put my bias in favour of the bulls. The analysis of last week (here) is still valid. With a rather strong outlook on USDOLLAR I am not keen on going long GBP vs USD.
Ger30
Bearish bias for the week.
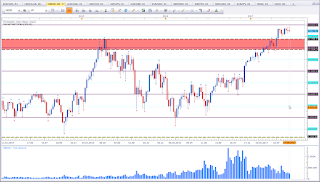
This is the weekly chart of DAX30 / Ger30. Price is at ATHs. We have a toppish looking market structure. Since the last four weeks pice was not able to move higher and kept closing at about the same level. This makes me want to look for short setups. Last week did close as a Shooting Star wich adds weight for the bearish outlook. We may see a correction from current levels. Keep in mind, the trend is bullish, and trends can last longer than anticipated.
SPX500 / S&P 500
Bearish bias for the week.
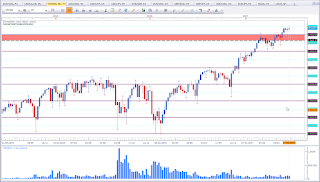
This is the weekly chart of SPX500 / S&P 500. We have about the same situation as described above for Ger30. Last week formed a Shooting Star. This puts my bias in favour of the bears.
Thank you for reading. If you have anything to add or any questions, please leave them in the comments section below.
Happy trading,
TT


Keine Kommentare:
Kommentar veröffentlichen