Mixed signal.
 |
| EUR vs USD W1 |
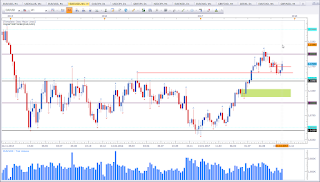
This is the weekly chart of EUR vs USD. Basically we have a bullish setup with a modified Morning Star Pattern. However, price was not able to close above the big bearish candle, which keeps me alert. I'll keep an eye on this asset. Maybe we will not see the test of the black horizontal line that I would love to see. A look at the Dollar Index might give some clues.
USDOLLAR
Mixed signal.
 |
| USDOLLAR W1 |
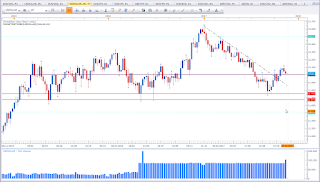
This is the weekly chart of FXCM USDOLLAR Index. Price formed an Indecision Candle at a level of interest. This may indicate potential strength. The 10 level proves to be relevant again. As long price is not able to violate the 10 level, the bias will remain mixed to bullish. This diminishes the potential bullish outlook on the asset above (EUR vs USD).
EUR vs CAD
Mixed signal.
 |
| EUR vs CAD W1 |
This is the weekly chart of EUR vs CAD. With the fifth attempt price managed to close above the 1,50 level. This is basically bullish. However, resistance at 1,5250 level is not far. Hence the label "mixed signal".
EUR vs NZD
Bullish bias for the week.
 |
| EUR vs NZD W1 |
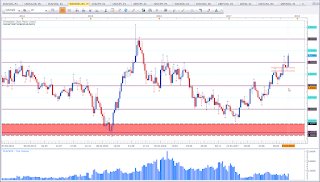
This is the weekly chart of EUR vs NZD. Price performed a strong bounce of a support level (red parallel lines) and a close above the 1,70 level. This puts my bias in favour of the bulls. We have all indications of a strong market.
EUR vs JPY
Mixed signal.
 |
| EUR vs JPY W1 |
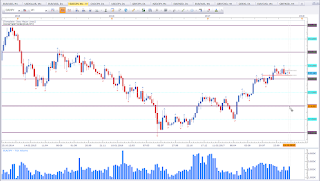
This is the weekly chart of EUR vs JPY. Price is in a congestion zone. This catches my attention. Once price breaks out, it will move far. So stay alert on this asset. Last week did close as a Rejection Candle. But I don't put much emphasis on the last week candle. Price is still above support (red horizontal line). As an aggressive approach, I'd like to see a close above or below the black dottet lines. Price has moved about 2.000 Pips without a pullback. This is not a guarantee for a move south, but it is something to consider if you want to trade support.
EUR vs AUD
Mixed signal.
 |
| EUR vs AUD W1 |
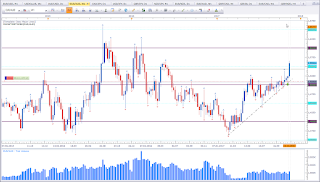
This is the weekly chart of EUR vs AUD. Price made a strong close above the 1,55 level. Price formed an ascending triangle that got broken at the same time. This is a bullish signal. However, price stopped at a level of interest. We may see a pause/reaction at the current level.
If you have any questions or feedback please leave them in the comments section below.
Happy trading,
TT
Keine Kommentare:
Kommentar veröffentlichen