Bullish bias for the week.
This is the weekly chart of EUR vs CAD. Last week performed well and made a strong close above 1,40 and above the mother candle. We may see a test of resistance ahead (former lows that got broken end of last year). That means the upside move may be a limited one.
EUR vs NZD
Mixed signal.
This is the weekly chart of EUR vs NZD. Last week closed as a Dragonfly Doji. This is bullish reversal pattern. It's not really the pattern that caught my interest. It is the candle and market structure that is of interest. Price stayed below 1,50 but shows rejection of the Bullish Engulfing level from about mid December 2016.
GBP vs USD
Bullish bias for the week.
This is the weekly chart of GBP vs USD. GBP vs USD found support at 1,20. Is this the new ATL? We don't know yet. It just shows USD weakness. Once USD resumes its strength, I think we'll see lower levels. Currently we have a Bullish Engufling Pattern at 1,20. And that is bullish for the time being.
GBP vs JPY
Mixed signal.
This is the weekly chart of GBP vs JPY. GBP vs JPY did break the recent low and came back to test the low. Last week did bounce off the lows, which is a bullish sign. But price is still inside the previous week range. I'll be keeping an eye for bullish setups during this week.
USD vs CHF
Mixed signal.
This is the weekly chart of USD vs CHF. There is no setup as of yet. But price is at an interesting level. Price is currently testing former range top. I'll be keeping an eye on this asset.
EUR vs AUD
Mixed signal.
This is the weekly chart of EUR vs AUD. Price has been at support for a while. I like how last week candle closed. It just aligns nicely with the support level. This close to support, I'll be looking to trade support.
EUR vs GBP
Bearish bias for the week.
This is the weekly chart of EUR vs GBP. Price formed a rejection candle last week. A close below the previous bullish candle would confirm the bearishness. There is still a week to go for this.
USD vs CAD
Bullish bias for the week.
This is the weekly chart of USD vs CAD. Price formed a Bullish Engulfing Pattern at the level of a previous Bullish Engulfing Pattern. This sets my bias to bullish for the week.
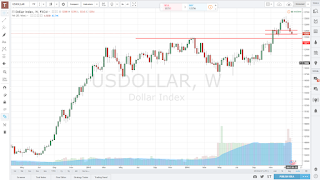
Before I close this weeks setups, I'd like to take a look at the USD Index.
This is the weekly timeframe of the Dollar Index. After recent USD strength, price pulled back. And we are at a level of a former Bullish Engulfing Pattern. A litle below, there is the support of former highs. This suggests we may see a resumption of the USD strength some time soon.
With this in mind, I am not too strong bullish on GBP vs USD. And USD vs CHF gains more interest. We already have a bullish setup for USD vs CAD, which may be a leading sign. However, if we get a resumption of USD strength, that would further confirm the bullish setup we have on USD vs CAD.
TT


Keine Kommentare:
Kommentar veröffentlichen