Bearish bias for the week.
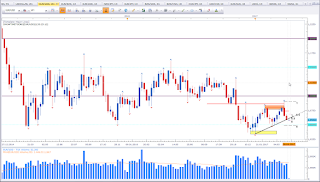
This is EUR vs USD weekly timeframe. With USD strength in the background I am rather bearish this asset. As price is in the vicinity of support there might be some sort of pullback so price is not at an ideal level to short. As price pulls back, I'll keep an eye on short setups on pullbacks.
EUR vs CAD
Bearish bias for the week.
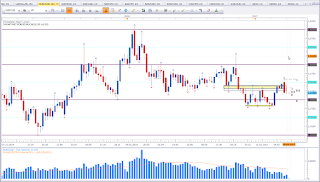
This is EUR vs CAD weekly timeframe. The original bias remains bearish. last week did close as a doji but the Bearish Engulfing Pattern is still valid. Looking at Market Structure we have early signs of a possible trend shift with a recent break of a lower high. But ultimate structure shows lower highs. A break above the Bearish Engulfing Pattern will confirm the new trend. A break below will confirm the bearish trend. This week may be the week that might confirm the bulls or the bears. For now I maintain my bearish bias.
CAD vs JPY
Bullish bias for the week.
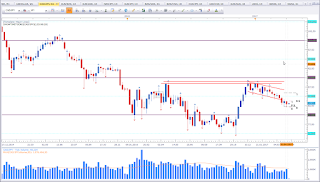
This is CAD vs JPY weekly timeframe. Price shows hesitation of moving lower. This is rather bullish. The lower wicks right on top of support give me a rather bullish bias for the week.
AUD vs NZD
Mixed signal.
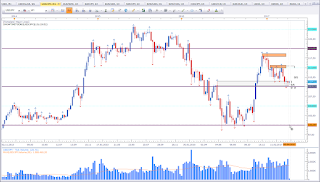
This is AUD vs NZD weekly timeframe. This asset is labeled as 'mixed signal' but it looks rather bullish for the time being. The reason for labeling this asset as mixed signal is, there is no setup yet. Last week candle shows signs of rejection. The two lower wicks confirm there is support at the current level. As long this level has not been violated support holds true. This is a successful test of support. This scenario was talked about end of March (first mentioned here).
GBP vs USD
Bearish bias for the week.
This is GBP vs USD weekly timeframe. Price formed a Bearish Engulfing Pattern at the resistance level and closed below 1,25. This puts my bias in favour of the bears. Keep in mind, price is in the vicinity of ATLs that have recently been formed. This means I am more than likely to work with profit targets within the red zone as the red zone may prove to be the ultimate low for this asset.
USD vs JPY
Bullish bias for the week.
This is USD vs JPY weekly timeframe. Last week Pinbar along with the rejection the previous week put my bias in favour of the bulls.
NZD vs USD
Mixed signal.
This is NZD vs USD weekly timeframe. Price did confirm my bearish view with the close below the congestion zone. This is basically bearish. But being just on top of support am inclined to look for a trade breaking the low of last week. Instead I'll look for a test of the congestion low price broke last week.
GBP vs AUD
Bearish bias for the week.
This is GBP vs AUD weekly timeframe. Last week almost formed a Doji. We have an Indecision Candle inside the upper wick of an Indecision Candle. This shows me resistance to move higher. If price has a hard time to move up, then there is a higher likelyhood of price moving down. Price was not able to violate 1,65 which adds further bearishness. A weekly close above the Doji and idealla above the last Bearish Engulfing Pattern (seen on the left) will terminate the bearisness until price reaches 1,70 area. But currently price seems more likely to move back to the yellow rectangle around 1,60 area.
Before I close this week analysis I'll have a closer look at the USD.
This is FXCM USDOLLAR weekly timeframe. Last week did confirm my bullish bias. The next resistance level I keep an eye on is a little below 12,500. Untill then price is bullish and should not face much turbulence on it's way up.
This confirms the bearish bias on EUR vs USD and GBP vs USD. And this also adds weight on my thoughs about NZD vs USD where I am waiting for a test of the previous congestion zone.
A look at EUR vs GBP should reveal which of the before mentioned pairs would be a better asset to short.
This is EUR vs GBP weekly timeframe. Currently it is not really easy to establish a solid bias. Price is testing a support level, but a better support level is further below (yellow rectangle). We may see a test of that level. Ultimately this is bullish EUR but for the week ahead, the signal is mixed.
Since EUR vs USD has already made a bearish move and GBP vs USD now formed a freash bearish setup, I'd tend to go with GBP vs USD. However, both assets are bearish.
Happy trading,
TT


Keine Kommentare:
Kommentar veröffentlichen