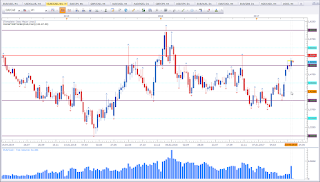
Bullish bias for the week.
This is EUR vs USD weekly chart. Price did break above the 1,10 level and most probably is going to
EUR vs CAD
Mixed signal.
This is EUR vs CAD weekly chart. Price did close nicely above 1,50 which would be a bullish indication. However, Price was not able close to above the wick (two candles to the left). To be bullish, we do not want hesitation breaking highs. Together with the red line highlighting a level of interest, the market structure suggests to be topping out. This is not a level I am interested in bullish setups. I am rather on observer mode on this market. We may see a rather strong pullback from the current level. I need to see the weekly close to establish a bias. I tend to be bearish below the red line. 1,45 area seems to be the most likely level for the pullback.
CAD vs JPY
Mixed signal.
This is CAD vs JPY weekly chart. The rejection of the 80 level suggests bullishness. The question now is, was the 80 level the end of the pullback? We have first signs of a trend shift. While this asset made lower lows and lower highs from 105 to 75, it now made a new high. Now we need to identify a higher low. This may have been at the 80 level. They say "only the ealry bird catches the worm". But in trading the early bird falls most often prey to the predator.
NZD vs CHF
Bearish bias for the week.
This is NZD vs CHF weekly chart. Last week I had a mixed bias. Last week close did show its bearish hands. Based on the market structure I see a good chance that price wants to test the 65 level. I am not a breakout trader, so I will look for setups on pullbacks.
USD vs JPY
Mixed signal.
This is the weekly chart of USD vs JPY. This asset is tricky. The overall picture is not clear at the moment. Either the overall picture is bearish and the strong up move was a strong pullback. Or the strong up move was a shift of trend and we should see a break of previous highs. The balck lines marking the low, the high and a higher low highlight a possible trend shift. What we currently see is a Bearish Engulfing Pattern which is a bearish setup. Micro structure is bearish with lower lows and lower highs. Being close to support I am not inclined to take a short trade with a break below the low of the Bearish Engulfing Pattern. The rather long lower wick of the engulfing candle shows signs of support above 110.
USD vs CHF
Bearish bias for the week.
This is the weekly chart of USD vs CHF. Price did break out to the downside as indicated last week. This puts my bias in favour of the bears.
Happy trading,
TT


Keine Kommentare:
Kommentar veröffentlichen