Mixed signal.
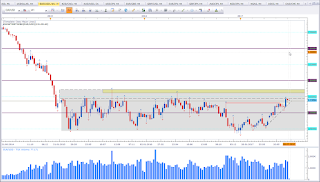
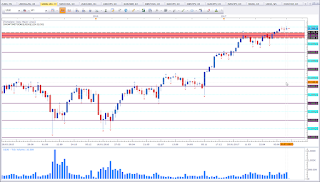
This is the weekly chart of EUR vs USD. We have a trend within a big range. Price formed successive higher highs and higher lows. Previously price broke above a resistance level and last week closed as a Rejection Candle. Last week close can mean two things. Either last week candlestick formation is a warning of a reversal (Hanging Man), which is a bearish reversal pattern, or last week candle can be regarded as a Rejection Candle which would be in in this instance a bullish continuation signal. I rather go with the trend and regard last week candle as a continuation signal. We may see price break the 1,15 level for the third time. This may be the week we test levels above 1,15. Ultimately I am bearish below the range resistance level. The closer price gets to the top of the range, the more interested I get for bearish setups. There is still more than 250 Pips distance to the top of the range which may be taken advantage off.
AUD vs NZD
Mixed signal.
This is the weekly chart of AUD vs NZD. Last week formed an Indecision Candle with long wicks on both sides. Price is indecisive. The only thing that can guide us is the support level this asset is sitting at. Above support I am bullish.
USD vs JPY
Mixed signal.
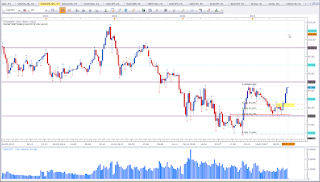
This is the weekly chart of USD vs JPY. This asset is interesting (along with the other JPY pairs). Among all JPY pairs, I mostly favour this one. Most of the JPY pairs already made a strong move up, and it seems USD vs JPY is going to catch up with the others. Price is now at a resistance below 115. If this week closes above resistance ideally above 115, we have a healthy sign for more bullishness. That would be the signal for the bullish trend to continue. The other JPY pairs already broke their previous highs. Below are some of the other JPY pairs.
CAD vs JPY
This is the weekly chart of CAD vs JPY. Price broke the previous high some time ago. This was the strongest mover among the JPY pairs.
EUR vs JPY
This is the weekly chart of EUR vs JPY. Price broke the previous high two weeks ago and is approaching the next resistance level.
GBP vs JPY
This is the weekly chart of GBP vs JPY. Price is approaching a resistance level. A break above would make way for a strong bullish move.
AUD vs JPY
This is the weekly chart of AUD vs JPY. Price did break the previous high some time ago and is now approaching the next resistance level. We have a higher high followed by a higher low. Now we price needs to break the high to confirm the bullish trend.
AUD vs USD
Bearish bias for the week.
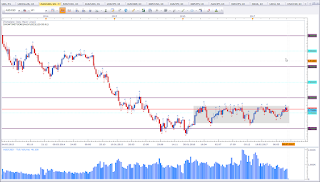
This is the weekly chart of AUD vs USD. Price is inside a range and currently testing range resistance. Price likes to spike before it follows market structure. We may see a final strike to resistance followed by a move back to range support. Last week did form a Dark Cloud Cover, which is a bearish reversal pattern. This puts my bias in favour of the bears. A conservative approach would be to wait for a close below the two red horizontal lines. But this confirmation would come with an increased stop. I will be keeping a close eye on this asset. Ideally price spikes up and gives a nice setup closer at the top of the range. As there is no such thing as a certain trade, we may get a breakout. A close above the range top would negate the bearish setup and we have to reevaluate.
EUR vs GBP
Mixed signal.
This is the weekly chart of EUR vs GBP. I have been monitoring patiently this asset since a couple of weeks. Price is still in the vicinity of resistance. Compared to the last 5 weeks we have a change in the closing price. Last week did close signficicantly higher compared to the last 5 weeks. But price failed to violate previous highs. As long price has failed to break the highs, I am rather bearish. So I label this asset as "mixed signal" and wait for the weekly close to establish a weekly bias.
NZD vs USD
Bearish bias for the week.
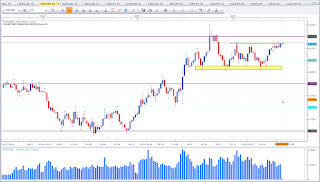
This is the weekly chart of NZD vs USD. Price formed a Bearish Engulfing Pattern at range resistance. This pattern puts my bias in favour of the bears. But this is not an ideal Bearish Engulfing Pattern. Ideally we have a small bullish candle and a bigger engulfing bearish candle. We may see another test of the yellow zone. As long price stays (closes) below the yellow zone my bias is bearish. Being so close to resistance, I am highly interested in this currency pair.
US30
Bearish bias for the week.
This is the weekly chart of US30. Price shows struggle breaking the previous highs. The current situation looks toppish. The last 4 weeks have about the same closing price and last week formed a Rejection Candle. Call it a Shooting Star if you like. Ideally the upper wick should have been longer, but the location and the shape qualifies for a Shooting Star. This and the fact that the closing prices are at about the same level puts my bias in favour of the bears.
USDOLLAR
Mixed signal.
This is the weekly chart of USDOLLAR. Last week formed a Piercing Pattern off a monthly level. Price has failed to break above the Trendline (dashed greay line). The Piercing Pattern is an early bullish sign. However, the immediate market structure is bearish. The immediate structure is a series of lower lows and lower highs. If the weekly closes above the Piercing Pattern and ideally above the lower high, than we have a shift of the immediate trend. The overall trend is still bullish. The level is sound for resumption of the overall market structure. We need to see the shift in the immediate trend first to confirm a resumption of the overall market structure.
Cross Currency Analysis
Having talked about the USDOLLAR I want to continue with Dollar. The current level USDOLLAR is sitting at is very interesting. Other assets confirm the potential of a shift in the immeditate trend. Looking at EUR vs USD, AUD vs USD, and NZD vs USD all of these mentioned assets are at range resistance, waiting for the USD to perform. If USD fails to deliver (gain strength) odds increase for a break of the range resistance. I will keep a keen eye on these mentioned assets. My bias is for range to hold. As long resistance is intact, trade resistance. This is also the reason why I am so interested in USD vs JPY.
Looking at AUD vs NZD we do not really see a setup yet. But price is sitting at support, which is rather a bullish sign. That would make NZD a favourable quote curreny to trade with USD. This may change though since there is not really a setup.
If you have any questions, please post them in the comments section below.
Happy trading,
TT






Keine Kommentare:
Kommentar veröffentlichen