Mixed signal.
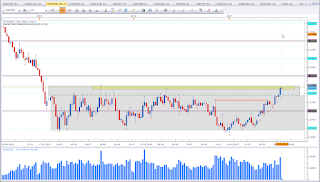
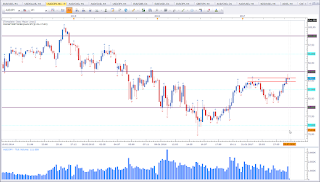
This is the weekly chart of EUR vs USD. It's the first time since 2015 that we have a weekly close above 1,15. This is a bullish sign. However, price is now testing a resistance level. Until last week, I was expecting price to fall back below the 1,15 and head back to the 1,05 level (range support). Price proved me wrong. So I have to re-evaluate. With price closing at resistance, I am rather on the sidelines. We may see a reaction at the yellow rectangle.
AUD vs CAD
Bearish bias for the week.
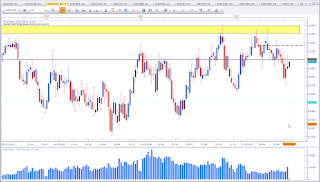
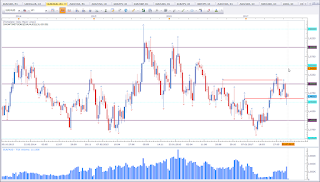
This is the weekly chart of AUD vs CAD. This is an interesting asset. A difficult one to trade. Techically we have a break of support followed by a test of support. This puts my bias in favour of the bears. However, we have successive higher lows, which is a bullish sign. We may see a test of the yellow rectangle in the near future. But what I see now is a test of resistance. Hence the bearish bias for the week.
CAD vs JPY
Mixed signal.
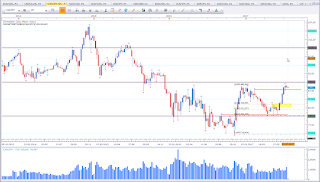
This is the weekly chart of CAD vs JPY. CAD has been strong since the beginning of June. Now price reached a resistance level and it seems CAD vs JPY is not able to violate this level. This puts my bias from bullish to neutral.
AUD vs NZD
Bearish bias for the week.
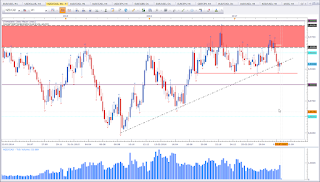
This is the weekly chart of AUD vs NZD. Price bounced off stronlgy off the support level (yellow rectangle) only to test the resistance level it broke in may (red line). We have a Shooting Star at a level of interest. This puts my bias in favour of the bears.
NZD vs CAD
Bullish bias for the week.
This is the weekly chart of NZD vs CAD. Price is at an interesting level. I am inclined to put my bias as mixed as the setup is not a clear set setup. We can only work with what we currently see on the charts. This is what I see. Price shows sings of support at the level of interest. We don't have a violation of the support level. Two weeks in a row mark about the same low. This puts my bias in favour of the bulls. We may see another run to the ATHs.
GBP vs JPY
Bearish bias for the week.
This is the weekly chart of GBP vs JPY. Price failed to violate the swing high. This is not a healthy sign for the bulls. Additionally last week closed as a Bearish Engulfing Pattern. These two put my bias in favour of the bears.
AUD vs JPY
Bearish bias for the week.
This is the weekly chart of AUD vs JPY. After recent Aussie strenght price failed to close above the swing high and formed a Shooting Star. This puts my bias in favour of the bears.
EUR vs AUD
Bullish bias for the week.
This is the weekly chart of EUR vs AUD. Price shows a Rejection Candle at a level of interest. Last week I did talk about the low that needs to get violated first. (see here) This did not happen. This together with the Rejection Candle put my bias in favour of the bulls.
NGAS
Bearish bias for the week.
This is the weekly chart of NGAS. Price did form a Rejection Candle and closed below the 3,0 level. This puts my bias in favour of the bears.
Cross-Currency-Analysis
AUD appears as the weakest currency for the week. So I will be keeping an eye for opportunities to short the Aussie. EUR appears to be strong, but as EUR approaches a resisance level I might opt to look for another asset to match Aussie with. AUD vs JPY appears vervy interesting. We may see JPY regain strength. So AUD vs JPY is an interesting asset to look to short.Another good match would be the NZD as NZD also seems to be a strong asset. My favourite assets to trade are AUD vs JPY and AUD vs NZD.
I hope you enjoyed reading and studying my charts.
If you have any questions, please leave them in the comments section below.
Happy trading,
TT



Keine Kommentare:
Kommentar veröffentlichen